Free Statistics

of Irreproducible Research!

Author's title

Author*Unverified author*
R Software Modulerwasp_boxcoxnorm.wasp
Title produced by softwareBox-Cox Normality Plot
Date of computationFri, 03 Dec 2021 16:41:51 +0100
Cite this page as followsStatistical Computations at FreeStatistics.org, Office for Research Development and Education, URL https://freestatistics.org/blog/index.php?v=date/2021/Dec/03/t1638546170if09l1lrm66pre6.htm/, Retrieved Wed, 15 May 2024 14:05:27 +0000
Statistical Computations at FreeStatistics.org, Office for Research Development and Education, URL https://freestatistics.org/blog/index.php?pk=319571, Retrieved Wed, 15 May 2024 14:05:27 +0000
QR Codes:

Original text written by user:
IsPrivate?No (this computation is public)
User-defined keywords
Estimated Impact56
Family? (F = Feedback message, R = changed R code, M = changed R Module, P = changed Parameters, D = changed Data)
-       [Box-Cox Normality Plot] [normalise rattigan] [2021-12-03 15:41:51] [d41d8cd98f00b204e9800998ecf8427e] [Current]
Feedback Forum

Post a new message
Dataseries X:
2.415501
2.168898
2.432098
2.174328
2.099661
2.935423
3.093037
2.592143
2.918949
2.446107
2.710854
2.767778
2.563861
2.495448
2.605549
0.311995
0.441616
0.613067
0.330705
0.3153
1.868836
2.279893
1.925244
2.016123
1.962435
11.38193
11.99706
10.91963
10.51255
11.01243
8.372417
8.372197
8.385193
8.374125
8.493866
9.727474
9.566179
9.647527
9.654252
9.721341
9.251006
9.232507
9.323701
9.327206
9.184279
8.424305
8.464963
8.369531
8.46022
8.218574
10.94917
11.05125
10.95004
11.08956
11.09863
21.84242
21.9329
21.86025
21.98834
21.75776
4.795404
2.768361
6.302546
5.747964
4.97656
6.101135
5.355104
7.949373
5.200136
10.36058
4.884692
5.88694
4.627236
3.955215
3.716566
0.469301
2.998476
8.172923
0.661611
14.48802
3.978947
16.46926
5.7242
22.91694
4.730297
18.076
17.02052
12.88293
15.96065
30.57997
9.479219
9.72243
9.353061
9.266094
9.522945
10.79383
11.35194
11.00506
10.91055
10.6876
11.16994
10.43821
10.3213
10.42881
10.34557
6.990142
7.137126
7.110222
7.649185
7.031722
8.697682
9.784826
9.47703
8.849795
9.363136
21.5911
20.45157
22.31552
21.79925
23.37978
2.785366
1.912723
2.267011
3.596483
3.09791
2.5305
3.531426
3.931306
2.690987
3.217676
4.091431
2.974305
3.038909
3.392431
2.575394
0.840687
0.485394
2.008808
1.857449
0.704541
2.185337
3.051988
3.629777
2.624311
2.332169
10.54211
11.67797
11.51093
10.53084
11.57712
1.570445
1.179703
0.898674
2.30918
1.827396
3.921568
3.486165
3.038736
3.699757
3.165028
3.437124
3.359138
2.553545
3.66227
2.78473
15.02523
14.63072
17.9196
17.9862
17.42762
28.77732
29.70086
29.67406
29.97339
28.19492
54.00367
44.69015
56.01736
58.00124
48.63852
67.63428
67.21798
62.4444
61.18613
63.79298
63.67079
66.77854
59.97629
58.94496
50.28302
71.34461
75.22542
73.118
71.97693
74.61436
47.83433
53.32855
52.09002
51.1835
51.22788
51.8108
51.41196
51.88306
54.02332
54.65742
72.30468
74.73261
72.75586
74.71005
77.57959
36.83874
26.48831
26.37389
22.00326
26.35999
11.347
10.1328
11.99913
9.675818
9.564528
35.06803
32.45084
30.65876
32.12157
21.22439
21.87961
38.20977
30.14414
38.75254
32.38573
24.5019
22.2378
16.28407
22.38315
32.6859
13.77774
24.41801
17.74343
29.21505
22.3633
0.231542
0.228083
0.202333
0.265579
0.257704
0.479409
0.476073
0.45186
0.639742
0.399069
0.525001
0.478163
0.482055
0.47458
0.525368
0.000233
0.001165
0.000233
0.000233
0.001983
0.005362
0.001946
0.000233
0.000233
0.000233
2.750911
2.692129
2.564798
2.874107
2.574412
0.144549
0.138649
0.127347
0.145853
0.186378
0.209628
0.174145
0.224251
0.178994
0.142025
0.185612
0.200934
0.19839
0.180866
0.164333
0.000233
0.000233
0.000233
0.000233
0.000233
0.000233
0.000233
0.000233
0.000233
0.000233
1.480102
1.372283
1.274223
1.395392
1.262618
11.50606
12.09423
10.50466
10.64118
9.762154
16.10544
15.58351
14.03411
11.31524
8.807919
15.97569
15.9958
15.73043
15.34005
14.86126
8.634942
8.859185
9.009516
8.15617
7.933419
7.956436
8.464923
7.821401
8.134938
7.699527
14.82083
15.67597
15.56095
15.54941
16.35226


Summary of computational transaction
Raw Input view raw input (R code)
Raw Outputview raw output of R engine
Computing time1 seconds
R ServerBig Analytics Cloud Computing Center

\begin{tabular}{lllllllll}
\hline
Summary of computational transaction \tabularnewline
Raw Input view raw input (R code)  \tabularnewline
Raw Outputview raw output of R engine  \tabularnewline
Computing time1 seconds \tabularnewline
R ServerBig Analytics Cloud Computing Center \tabularnewline
\hline
\end{tabular}
%Source: https://freestatistics.org/blog/index.php?pk=319571&T=0

[TABLE]
[ROW]
Summary of computational transaction[/C][/ROW] [ROW]Raw Input[/C] view raw input (R code) [/C][/ROW] [ROW]Raw Output[/C]view raw output of R engine [/C][/ROW] [ROW]Computing time[/C]1 seconds[/C][/ROW] [ROW]R Server[/C]Big Analytics Cloud Computing Center[/C][/ROW] [/TABLE] Source: https://freestatistics.org/blog/index.php?pk=319571&T=0

Globally Unique Identifier (entire table): ba.freestatistics.org/blog/index.php?pk=319571&T=0

As an alternative you can also use a QR Code:  

The GUIDs for individual cells are displayed in the table below:

Summary of computational transaction
Raw Input view raw input (R code)
Raw Outputview raw output of R engine
Computing time1 seconds
R ServerBig Analytics Cloud Computing Center


Box-Cox Normality Plot
# observations x330
maximum correlation0.989931405195132
optimal lambda0.29
transformation formulafor all lambda <> 0 : T(Y) = (Y^lambda - 1) / lambda

\begin{tabular}{lllllllll}
\hline
Box-Cox Normality Plot \tabularnewline
# observations x & 330 \tabularnewline
maximum correlation & 0.989931405195132 \tabularnewline
optimal lambda & 0.29 \tabularnewline
transformation formula & for all lambda <> 0 : T(Y) = (Y^lambda - 1) / lambda \tabularnewline
\hline
\end{tabular}
%Source: https://freestatistics.org/blog/index.php?pk=319571&T=1

[TABLE]
[ROW][C]Box-Cox Normality Plot[/C][/ROW]
[ROW][C]# observations x[/C][C]330[/C][/ROW]
[ROW][C]maximum correlation[/C][C]0.989931405195132[/C][/ROW]
[ROW][C]optimal lambda[/C][C]0.29[/C][/ROW]
[ROW][C]transformation formula[/C][C]for all lambda <> 0 : T(Y) = (Y^lambda - 1) / lambda[/C][/ROW]
[/TABLE]
Source: https://freestatistics.org/blog/index.php?pk=319571&T=1

Globally Unique Identifier (entire table): ba.freestatistics.org/blog/index.php?pk=319571&T=1

As an alternative you can also use a QR Code:  

The GUIDs for individual cells are displayed in the table below:

Box-Cox Normality Plot
# observations x330
maximum correlation0.989931405195132
optimal lambda0.29
transformation formulafor all lambda <> 0 : T(Y) = (Y^lambda - 1) / lambda


Maximum Likelihood Estimation of Lambda
> summary(mypT)
bcPower Transformation to Normality 
  Est Power Rounded Pwr Wald Lwr Bnd Wald Upr Bnd
x    0.2547        0.25       0.2143       0.2951
Likelihood ratio test that transformation parameter is equal to 0
 (log transformation)
                           LRT df       pval
LR test, lambda = (0) 218.7948  1 < 2.22e-16
Likelihood ratio test that no transformation is needed
                           LRT df       pval
LR test, lambda = (1) 630.2517  1 < 2.22e-16

\begin{tabular}{lllllllll}
\hline
Maximum Likelihood Estimation of Lambda \tabularnewline
> summary(mypT)
bcPower Transformation to Normality 
  Est Power Rounded Pwr Wald Lwr Bnd Wald Upr Bnd
x    0.2547        0.25       0.2143       0.2951
Likelihood ratio test that transformation parameter is equal to 0
 (log transformation)
                           LRT df       pval
LR test, lambda = (0) 218.7948  1 < 2.22e-16
Likelihood ratio test that no transformation is needed
                           LRT df       pval
LR test, lambda = (1) 630.2517  1 < 2.22e-16
\tabularnewline \hline \end{tabular} %Source: https://freestatistics.org/blog/index.php?pk=319571&T=2

[TABLE]
[ROW][C]Maximum Likelihood Estimation of Lambda[/C][/ROW]
[ROW][C]
> summary(mypT)
bcPower Transformation to Normality 
  Est Power Rounded Pwr Wald Lwr Bnd Wald Upr Bnd
x    0.2547        0.25       0.2143       0.2951
Likelihood ratio test that transformation parameter is equal to 0
 (log transformation)
                           LRT df       pval
LR test, lambda = (0) 218.7948  1 < 2.22e-16
Likelihood ratio test that no transformation is needed
                           LRT df       pval
LR test, lambda = (1) 630.2517  1 < 2.22e-16
[/C][/ROW] [/TABLE] Source: https://freestatistics.org/blog/index.php?pk=319571&T=2

Globally Unique Identifier (entire table): ba.freestatistics.org/blog/index.php?pk=319571&T=2

As an alternative you can also use a QR Code:  

The GUIDs for individual cells are displayed in the table below:

Maximum Likelihood Estimation of Lambda
> summary(mypT)
bcPower Transformation to Normality 
  Est Power Rounded Pwr Wald Lwr Bnd Wald Upr Bnd
x    0.2547        0.25       0.2143       0.2951
Likelihood ratio test that transformation parameter is equal to 0
 (log transformation)
                           LRT df       pval
LR test, lambda = (0) 218.7948  1 < 2.22e-16
Likelihood ratio test that no transformation is needed
                           LRT df       pval
LR test, lambda = (1) 630.2517  1 < 2.22e-16


Parameters (Session):
par1 = Full Box-Cox transform ; par2 = -2 ; par3 = 2 ; par4 = 0 ; par5 = No ;
Parameters (R input):
par1 = Full Box-Cox transform ; par2 = -2 ; par3 = 2 ; par4 = 0 ; par5 = No ;
R code (references can be found in the software module):
par5 <- 'No'
par4 <- '0'
par3 <- '2'
par2 <- '-2'
par1 <- 'Full Box-Cox transform'
library(car)
par2 <- abs(as.numeric(par2)*100)
par3 <- as.numeric(par3)*100
if(par4=='') par4 <- 0
par4 <- as.numeric(par4)
numlam <- par2 + par3 + 1
x <- x + par4
n <- length(x)
c <- array(NA,dim=c(numlam))
l <- array(NA,dim=c(numlam))
mx <- -1
mxli <- -999
for (i in 1:numlam)
{
l[i] <- (i-par2-1)/100
if (l[i] != 0)
{
if (par1 == 'Full Box-Cox transform') x1 <- (x^l[i] - 1) / l[i]
if (par1 == 'Simple Box-Cox transform') x1 <- x^l[i]
} else {
x1 <- log(x)
}
c[i] <- cor(qnorm(ppoints(x), mean=0, sd=1),sort(x1))
if (mx < c[i])
{
mx <- c[i]
mxli <- l[i]
x1.best <- x1
}
}
print(c)
print(mx)
print(mxli)
print(x1.best)
if (mxli != 0)
{
if (par1 == 'Full Box-Cox transform') x1 <- (x^mxli - 1) / mxli
if (par1 == 'Simple Box-Cox transform') x1 <- x^mxli
} else {
x1 <- log(x)
}
mypT <- powerTransform(x)
summary(mypT)
bitmap(file='test1.png')
plot(l,c,main='Box-Cox Normality Plot', xlab='Lambda',ylab='correlation')
mtext(paste('Optimal Lambda =',mxli))
grid()
dev.off()
bitmap(file='test2.png')
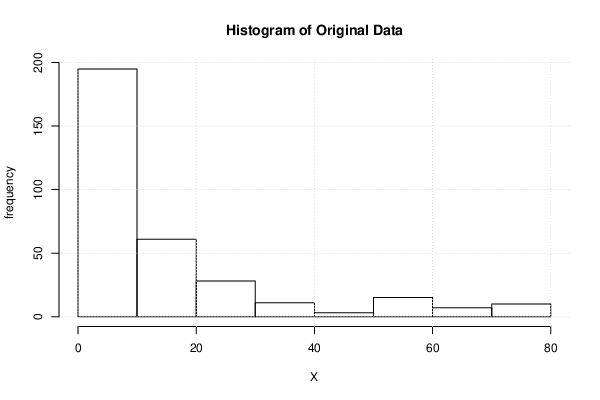
hist(x,main='Histogram of Original Data',xlab='X',ylab='frequency')
grid()
dev.off()
bitmap(file='test3.png')
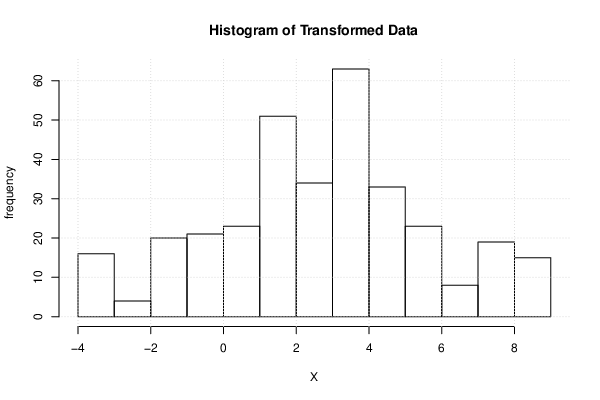
hist(x1,main='Histogram of Transformed Data', xlab='X',ylab='frequency')
grid()
dev.off()
bitmap(file='test4.png')
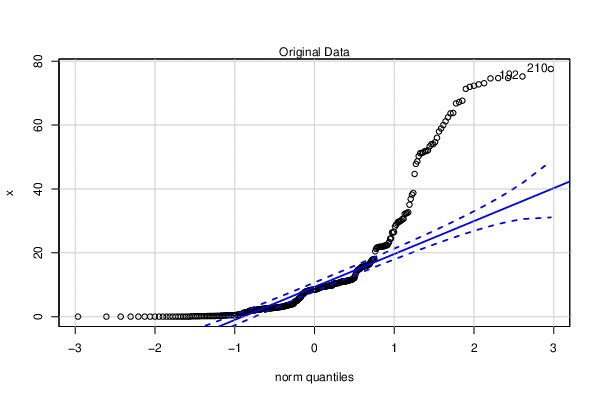
qqPlot(x)
grid()
mtext('Original Data')
dev.off()
bitmap(file='test5.png')
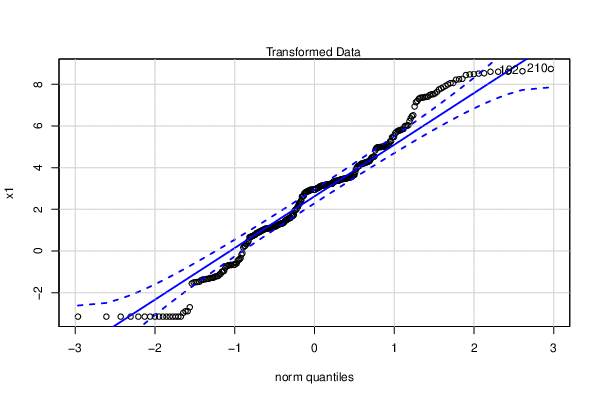
qqPlot(x1)
grid()
mtext('Transformed Data')
dev.off()
load(file='createtable')
a<-table.start()
a<-table.row.start(a)
a<-table.element(a,'Box-Cox Normality Plot',2,TRUE)
a<-table.row.end(a)
a<-table.row.start(a)
a<-table.element(a,'# observations x',header=TRUE)
a<-table.element(a,n)
a<-table.row.end(a)
a<-table.row.start(a)
a<-table.element(a,'maximum correlation',header=TRUE)
a<-table.element(a,mx)
a<-table.row.end(a)
a<-table.row.start(a)
a<-table.element(a,'optimal lambda',header=TRUE)
a<-table.element(a,mxli)
a<-table.row.end(a)
a<-table.row.start(a)
a<-table.element(a,'transformation formula',header=TRUE)
if (par1 == 'Full Box-Cox transform') {
a<-table.element(a,'for all lambda <> 0 : T(Y) = (Y^lambda - 1) / lambda')
} else {
a<-table.element(a,'for all lambda <> 0 : T(Y) = Y^lambda')
}
a<-table.row.end(a)
if(mx<0) {
a<-table.row.start(a)
a<-table.element(a,'Warning: maximum correlation is negative! The Box-Cox transformation must not be used.',2)
a<-table.row.end(a)
}
a<-table.end(a)
table.save(a,file='mytable.tab')
if(par5=='Yes') {
a<-table.start()
a<-table.row.start(a)
a<-table.element(a,'Obs.',header=T)
a<-table.element(a,'Original',header=T)
a<-table.element(a,'Transformed',header=T)
a<-table.row.end(a)
for (i in 1:n) {
a<-table.row.start(a)
a<-table.element(a,i)
a<-table.element(a,x[i])
a<-table.element(a,x1.best[i])
a<-table.row.end(a)
}
a<-table.end(a)
table.save(a,file='mytable1.tab')
}
a<-table.start()
a<-table.row.start(a)
a<-table.element(a,'Maximum Likelihood Estimation of Lambda',1,TRUE)
a<-table.row.end(a)
a<-table.row.start(a)
a<-table.element(a,paste('
',RC.texteval('summary(mypT)'),'
',sep=''))
a<-table.row.end(a)
a<-table.end(a)
table.save(a,file='mytable3.tab')