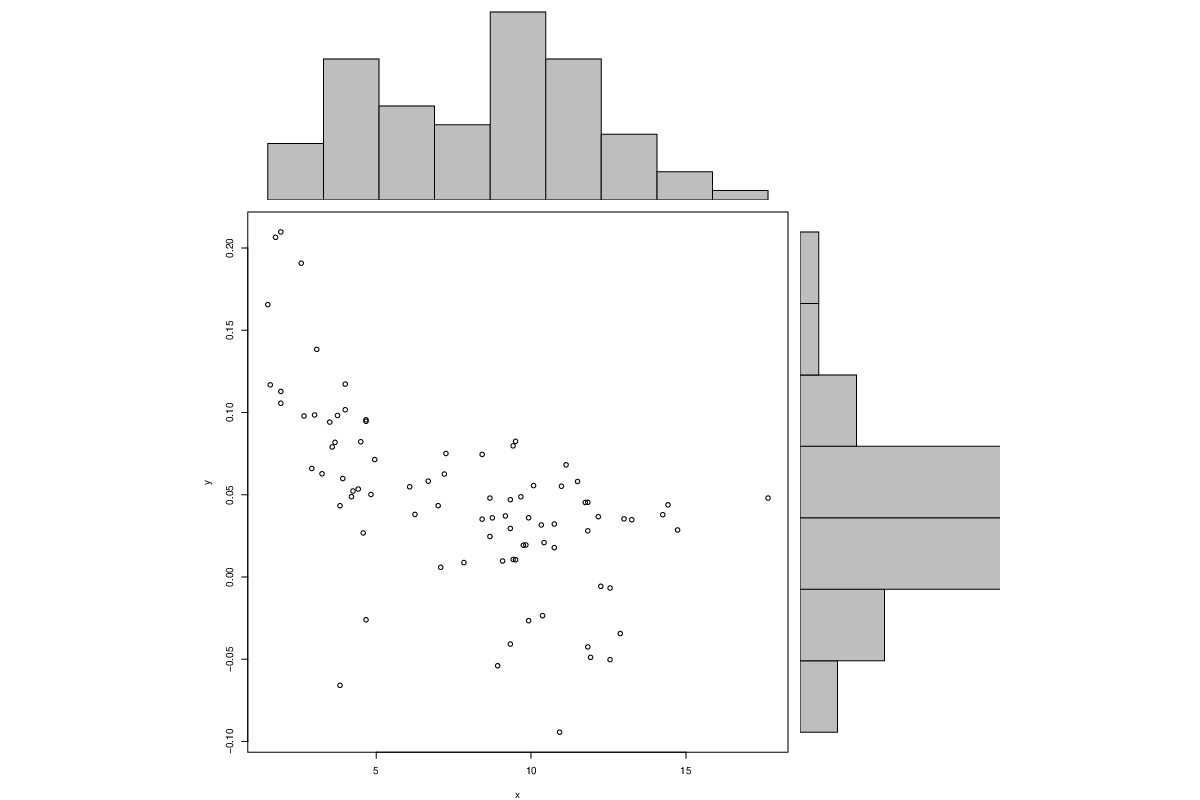
| Pearson Product Moment Correlation - Ungrouped Data | ||
| Statistic | Variable X | Variable Y |
| Mean | 7.81647058823529 | 0.0473511857411765 |
| Biased Variance | 14.4950369550173 | 0.00304982585261907 |
| Biased Standard Deviation | 3.80723481742554 | 0.0552252284071245 |
| Covariance | -0.12650634278021 | |
| Correlation | -0.594600783128166 | |
| Determination | 0.353550091296629 | |
| T-Test | -6.73747371413984 | |
| p-value (2 sided) | 1.97318578262705e-09 | |
| p-value (1 sided) | 9.86592891313524e-10 | |
| 95% CI of Correlation | [-0.716879242574732, -0.43683393280442] | |
| Degrees of Freedom | 83 | |
| Number of Observations | 85 | |
| Normality Tests |
> jarque.x Jarque-Bera Normality Test data: x JB = 3.2543, p-value = 0.1965 alternative hypothesis: greater |
> jarque.y Jarque-Bera Normality Test data: y JB = 6.506, p-value = 0.03866 alternative hypothesis: greater |
> ad.x Anderson-Darling normality test data: x A = 1.5226, p-value = 0.0005906 |
> ad.y Anderson-Darling normality test data: y A = 1.121, p-value = 0.005852 |