| Pearson Product Moment Correlation - Ungrouped Data | ||
| Statistic | Variable X | Variable Y |
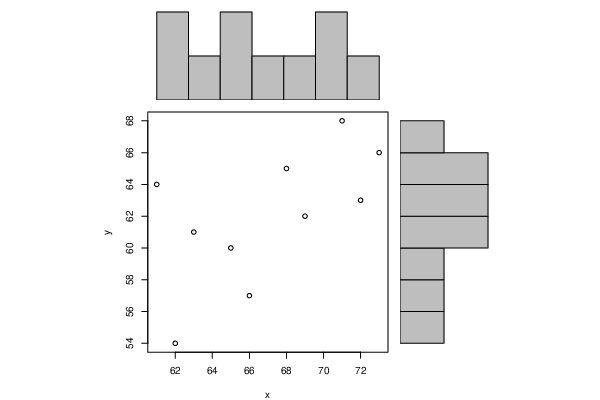
| Mean | 67 | 62 |
| Biased Variance | 16.4 | 16 |
| Biased Standard Deviation | 4.04969134626332 | 4 |
| Covariance | 10.7777777777778 | |
| Correlation | 0.598811067968814 | |
| Determination | 0.358574695121951 | |
| T-Test | 2.11476331361597 | |
| p-value (2 sided) | 0.0673720628516747 | |
| p-value (1 sided) | 0.0336860314258373 | |
| 95% CI of Correlation | [-0.0494648117682983, 0.892093758725416] | |
| Degrees of Freedom | 8 | |
| Number of Observations | 10 | |
| Normality Tests |
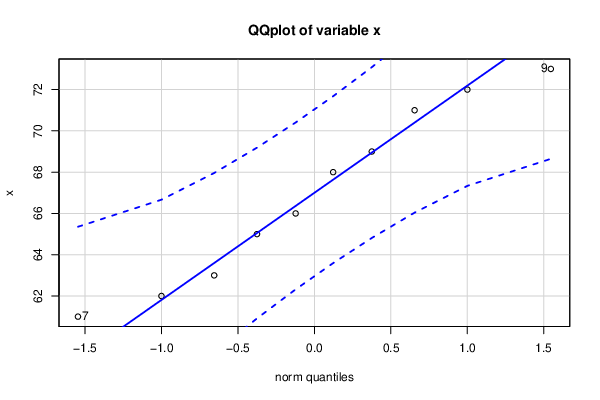
> jarque.x Jarque-Bera Normality Test data: x JB = 0.78037, p-value = 0.6769 alternative hypothesis: greater |
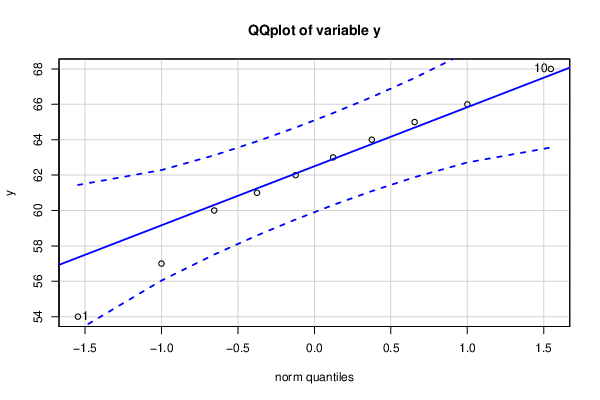
> jarque.y Jarque-Bera Normality Test data: y JB = 0.54924, p-value = 0.7599 alternative hypothesis: greater |
> ad.x Anderson-Darling normality test data: x A = 0.21479, p-value = 0.7899 |
> ad.y Anderson-Darling normality test data: y A = 0.1729, p-value = 0.8997 |