Free Statistics

of Irreproducible Research!

Author's title

Author*Unverified author*
R Software Modulerwasp_autocorrelation.wasp
Title produced by software(Partial) Autocorrelation Function
Date of computationWed, 27 Nov 2019 19:31:48 +0100
Cite this page as followsStatistical Computations at FreeStatistics.org, Office for Research Development and Education, URL https://freestatistics.org/blog/index.php?v=date/2019/Nov/27/t1574879589keg3306dtyow611.htm/, Retrieved Fri, 17 May 2024 04:18:26 +0000
Statistical Computations at FreeStatistics.org, Office for Research Development and Education, URL https://freestatistics.org/blog/index.php?pk=318954, Retrieved Fri, 17 May 2024 04:18:26 +0000
QR Codes:

Original text written by user:
IsPrivate?No (this computation is public)
User-defined keywords
Estimated Impact107
Family? (F = Feedback message, R = changed R code, M = changed R Module, P = changed Parameters, D = changed Data)
-       [(Partial) Autocorrelation Function] [] [2019-11-27 18:31:48] [d41d8cd98f00b204e9800998ecf8427e] [Current]
Feedback Forum

Post a new message
Dataseries X:
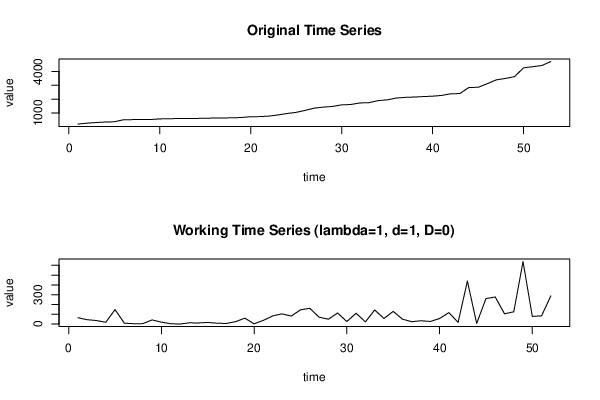
211.5
276.0
320.5
356.5
374.0
522.0
531.0
535.0
539.5
581.5
601.0
604.5
604.5
617.0
628.5
645.0
653.5
659.5
684.0
744.5
746.5
784.5
867.5
972.0
1053.5
1199.0
1360.0
1430.5
1480.0
1593.0
1619.0
1729.5
1751.5
1895.5
1952.5
2082.0
2132.0
2156.0
2190.0
2216.5
2273.0
2390.0
2407.5
2847.0
2853.5
3113.5
3390.5
3495.5
3620.5
4259.5
4337.5
4421.5
4709.5


Summary of computational transaction
Raw Input view raw input (R code)
Raw Outputview raw output of R engine
Computing time1 seconds
R ServerBig Analytics Cloud Computing Center

\begin{tabular}{lllllllll}
\hline
Summary of computational transaction \tabularnewline
Raw Input view raw input (R code)  \tabularnewline
Raw Outputview raw output of R engine  \tabularnewline
Computing time1 seconds \tabularnewline
R ServerBig Analytics Cloud Computing Center \tabularnewline
\hline
\end{tabular}
%Source: https://freestatistics.org/blog/index.php?pk=318954&T=0

[TABLE]
[ROW]
Summary of computational transaction[/C][/ROW] [ROW]Raw Input[/C] view raw input (R code) [/C][/ROW] [ROW]Raw Output[/C]view raw output of R engine [/C][/ROW] [ROW]Computing time[/C]1 seconds[/C][/ROW] [ROW]R Server[/C]Big Analytics Cloud Computing Center[/C][/ROW] [/TABLE] Source: https://freestatistics.org/blog/index.php?pk=318954&T=0

Globally Unique Identifier (entire table): ba.freestatistics.org/blog/index.php?pk=318954&T=0

As an alternative you can also use a QR Code:  

The GUIDs for individual cells are displayed in the table below:

Summary of computational transaction
Raw Input view raw input (R code)
Raw Outputview raw output of R engine
Computing time1 seconds
R ServerBig Analytics Cloud Computing Center


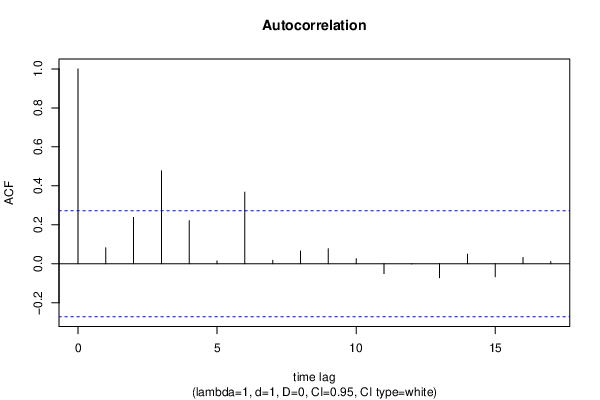
Autocorrelation Function
Time lag kACF(k)T-STATP-value
10.0816220.58860.279345
20.2376151.71350.046291
30.4774743.44310.000572
40.2210231.59380.058519
50.0143950.10380.458862
60.3672882.64860.005339
70.0177810.12820.449233
80.0649050.4680.320856
90.0770010.55530.290548
100.0256850.18520.426888
11-0.05045-0.36380.35874
12-0.00062-0.00450.498225
13-0.071743-0.51730.303553
140.0489830.35320.362675
15-0.066436-0.47910.316947
160.0314730.2270.410673
170.0114230.08240.467334

\begin{tabular}{lllllllll}
\hline
Autocorrelation Function \tabularnewline
Time lag k & ACF(k) & T-STAT & P-value \tabularnewline
1 & 0.081622 & 0.5886 & 0.279345 \tabularnewline
2 & 0.237615 & 1.7135 & 0.046291 \tabularnewline
3 & 0.477474 & 3.4431 & 0.000572 \tabularnewline
4 & 0.221023 & 1.5938 & 0.058519 \tabularnewline
5 & 0.014395 & 0.1038 & 0.458862 \tabularnewline
6 & 0.367288 & 2.6486 & 0.005339 \tabularnewline
7 & 0.017781 & 0.1282 & 0.449233 \tabularnewline
8 & 0.064905 & 0.468 & 0.320856 \tabularnewline
9 & 0.077001 & 0.5553 & 0.290548 \tabularnewline
10 & 0.025685 & 0.1852 & 0.426888 \tabularnewline
11 & -0.05045 & -0.3638 & 0.35874 \tabularnewline
12 & -0.00062 & -0.0045 & 0.498225 \tabularnewline
13 & -0.071743 & -0.5173 & 0.303553 \tabularnewline
14 & 0.048983 & 0.3532 & 0.362675 \tabularnewline
15 & -0.066436 & -0.4791 & 0.316947 \tabularnewline
16 & 0.031473 & 0.227 & 0.410673 \tabularnewline
17 & 0.011423 & 0.0824 & 0.467334 \tabularnewline
\hline
\end{tabular}
%Source: https://freestatistics.org/blog/index.php?pk=318954&T=1

[TABLE]
[ROW][C]Autocorrelation Function[/C][/ROW]
[ROW][C]Time lag k[/C][C]ACF(k)[/C][C]T-STAT[/C][C]P-value[/C][/ROW]
[ROW][C]1[/C][C]0.081622[/C][C]0.5886[/C][C]0.279345[/C][/ROW]
[ROW][C]2[/C][C]0.237615[/C][C]1.7135[/C][C]0.046291[/C][/ROW]
[ROW][C]3[/C][C]0.477474[/C][C]3.4431[/C][C]0.000572[/C][/ROW]
[ROW][C]4[/C][C]0.221023[/C][C]1.5938[/C][C]0.058519[/C][/ROW]
[ROW][C]5[/C][C]0.014395[/C][C]0.1038[/C][C]0.458862[/C][/ROW]
[ROW][C]6[/C][C]0.367288[/C][C]2.6486[/C][C]0.005339[/C][/ROW]
[ROW][C]7[/C][C]0.017781[/C][C]0.1282[/C][C]0.449233[/C][/ROW]
[ROW][C]8[/C][C]0.064905[/C][C]0.468[/C][C]0.320856[/C][/ROW]
[ROW][C]9[/C][C]0.077001[/C][C]0.5553[/C][C]0.290548[/C][/ROW]
[ROW][C]10[/C][C]0.025685[/C][C]0.1852[/C][C]0.426888[/C][/ROW]
[ROW][C]11[/C][C]-0.05045[/C][C]-0.3638[/C][C]0.35874[/C][/ROW]
[ROW][C]12[/C][C]-0.00062[/C][C]-0.0045[/C][C]0.498225[/C][/ROW]
[ROW][C]13[/C][C]-0.071743[/C][C]-0.5173[/C][C]0.303553[/C][/ROW]
[ROW][C]14[/C][C]0.048983[/C][C]0.3532[/C][C]0.362675[/C][/ROW]
[ROW][C]15[/C][C]-0.066436[/C][C]-0.4791[/C][C]0.316947[/C][/ROW]
[ROW][C]16[/C][C]0.031473[/C][C]0.227[/C][C]0.410673[/C][/ROW]
[ROW][C]17[/C][C]0.011423[/C][C]0.0824[/C][C]0.467334[/C][/ROW]
[/TABLE]
Source: https://freestatistics.org/blog/index.php?pk=318954&T=1

Globally Unique Identifier (entire table): ba.freestatistics.org/blog/index.php?pk=318954&T=1

As an alternative you can also use a QR Code:  

The GUIDs for individual cells are displayed in the table below:

Autocorrelation Function
Time lag kACF(k)T-STATP-value
10.0816220.58860.279345
20.2376151.71350.046291
30.4774743.44310.000572
40.2210231.59380.058519
50.0143950.10380.458862
60.3672882.64860.005339
70.0177810.12820.449233
80.0649050.4680.320856
90.0770010.55530.290548
100.0256850.18520.426888
11-0.05045-0.36380.35874
12-0.00062-0.00450.498225
13-0.071743-0.51730.303553
140.0489830.35320.362675
15-0.066436-0.47910.316947
160.0314730.2270.410673
170.0114230.08240.467334


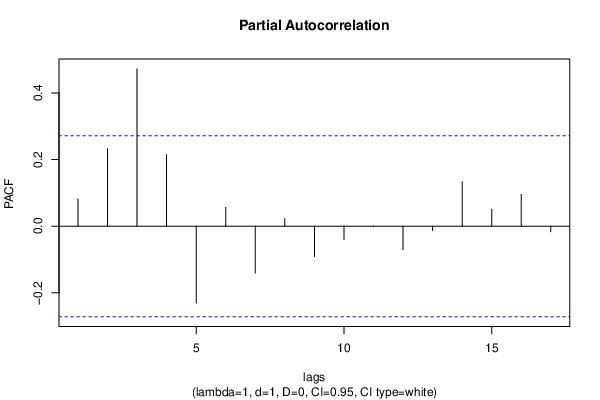
Partial Autocorrelation Function
Time lag kPACF(k)T-STATP-value
10.0816220.58860.279345
20.2325021.67660.049812
30.4721083.40440.000642
40.2146911.54820.063824
5-0.231118-1.66660.050802
60.0561530.40490.343598
7-0.140822-1.01550.157289
80.0221520.15970.436852
9-0.091045-0.65650.257187
10-0.039928-0.28790.387273
110.0007030.00510.497986
12-0.069903-0.50410.308167
13-0.01326-0.09560.462095
140.1330840.95970.170828
150.0511210.36860.356948
160.09540.68790.247273
17-0.016711-0.12050.452275

\begin{tabular}{lllllllll}
\hline
Partial Autocorrelation Function \tabularnewline
Time lag k & PACF(k) & T-STAT & P-value \tabularnewline
1 & 0.081622 & 0.5886 & 0.279345 \tabularnewline
2 & 0.232502 & 1.6766 & 0.049812 \tabularnewline
3 & 0.472108 & 3.4044 & 0.000642 \tabularnewline
4 & 0.214691 & 1.5482 & 0.063824 \tabularnewline
5 & -0.231118 & -1.6666 & 0.050802 \tabularnewline
6 & 0.056153 & 0.4049 & 0.343598 \tabularnewline
7 & -0.140822 & -1.0155 & 0.157289 \tabularnewline
8 & 0.022152 & 0.1597 & 0.436852 \tabularnewline
9 & -0.091045 & -0.6565 & 0.257187 \tabularnewline
10 & -0.039928 & -0.2879 & 0.387273 \tabularnewline
11 & 0.000703 & 0.0051 & 0.497986 \tabularnewline
12 & -0.069903 & -0.5041 & 0.308167 \tabularnewline
13 & -0.01326 & -0.0956 & 0.462095 \tabularnewline
14 & 0.133084 & 0.9597 & 0.170828 \tabularnewline
15 & 0.051121 & 0.3686 & 0.356948 \tabularnewline
16 & 0.0954 & 0.6879 & 0.247273 \tabularnewline
17 & -0.016711 & -0.1205 & 0.452275 \tabularnewline
\hline
\end{tabular}
%Source: https://freestatistics.org/blog/index.php?pk=318954&T=2

[TABLE]
[ROW][C]Partial Autocorrelation Function[/C][/ROW]
[ROW][C]Time lag k[/C][C]PACF(k)[/C][C]T-STAT[/C][C]P-value[/C][/ROW]
[ROW][C]1[/C][C]0.081622[/C][C]0.5886[/C][C]0.279345[/C][/ROW]
[ROW][C]2[/C][C]0.232502[/C][C]1.6766[/C][C]0.049812[/C][/ROW]
[ROW][C]3[/C][C]0.472108[/C][C]3.4044[/C][C]0.000642[/C][/ROW]
[ROW][C]4[/C][C]0.214691[/C][C]1.5482[/C][C]0.063824[/C][/ROW]
[ROW][C]5[/C][C]-0.231118[/C][C]-1.6666[/C][C]0.050802[/C][/ROW]
[ROW][C]6[/C][C]0.056153[/C][C]0.4049[/C][C]0.343598[/C][/ROW]
[ROW][C]7[/C][C]-0.140822[/C][C]-1.0155[/C][C]0.157289[/C][/ROW]
[ROW][C]8[/C][C]0.022152[/C][C]0.1597[/C][C]0.436852[/C][/ROW]
[ROW][C]9[/C][C]-0.091045[/C][C]-0.6565[/C][C]0.257187[/C][/ROW]
[ROW][C]10[/C][C]-0.039928[/C][C]-0.2879[/C][C]0.387273[/C][/ROW]
[ROW][C]11[/C][C]0.000703[/C][C]0.0051[/C][C]0.497986[/C][/ROW]
[ROW][C]12[/C][C]-0.069903[/C][C]-0.5041[/C][C]0.308167[/C][/ROW]
[ROW][C]13[/C][C]-0.01326[/C][C]-0.0956[/C][C]0.462095[/C][/ROW]
[ROW][C]14[/C][C]0.133084[/C][C]0.9597[/C][C]0.170828[/C][/ROW]
[ROW][C]15[/C][C]0.051121[/C][C]0.3686[/C][C]0.356948[/C][/ROW]
[ROW][C]16[/C][C]0.0954[/C][C]0.6879[/C][C]0.247273[/C][/ROW]
[ROW][C]17[/C][C]-0.016711[/C][C]-0.1205[/C][C]0.452275[/C][/ROW]
[/TABLE]
Source: https://freestatistics.org/blog/index.php?pk=318954&T=2

Globally Unique Identifier (entire table): ba.freestatistics.org/blog/index.php?pk=318954&T=2

As an alternative you can also use a QR Code:  

The GUIDs for individual cells are displayed in the table below:

Partial Autocorrelation Function
Time lag kPACF(k)T-STATP-value
10.0816220.58860.279345
20.2325021.67660.049812
30.4721083.40440.000642
40.2146911.54820.063824
5-0.231118-1.66660.050802
60.0561530.40490.343598
7-0.140822-1.01550.157289
80.0221520.15970.436852
9-0.091045-0.65650.257187
10-0.039928-0.28790.387273
110.0007030.00510.497986
12-0.069903-0.50410.308167
13-0.01326-0.09560.462095
140.1330840.95970.170828
150.0511210.36860.356948
160.09540.68790.247273
17-0.016711-0.12050.452275


Parameters (Session):
Parameters (R input):
par1 = Default ; par2 = 1 ; par3 = 1 ; par4 = 0 ; par5 = 1 ; par6 = White Noise ; par7 = 0.95 ; par8 = ;
R code (references can be found in the software module):
par8 <- ''
par7 <- '0.95'
par6 <- 'White Noise'
par5 <- '1'
par4 <- '0'
par3 <- '1'
par2 <- '1'
par1 <- 'Default'
if (par1 == 'Default') {
par1 = 10*log10(length(x))
} else {
par1 <- as.numeric(par1)
}
par2 <- as.numeric(par2)
par3 <- as.numeric(par3)
par4 <- as.numeric(par4)
par5 <- as.numeric(par5)
if (par6 == 'White Noise') par6 <- 'white' else par6 <- 'ma'
par7 <- as.numeric(par7)
if (par8 != '') par8 <- as.numeric(par8)
x <- na.omit(x)
ox <- x
if (par8 == '') {
if (par2 == 0) {
x <- log(x)
} else {
x <- (x ^ par2 - 1) / par2
}
} else {
x <- log(x,base=par8)
}
if (par3 > 0) x <- diff(x,lag=1,difference=par3)
if (par4 > 0) x <- diff(x,lag=par5,difference=par4)
bitmap(file='picts.png')
op <- par(mfrow=c(2,1))
plot(ox,type='l',main='Original Time Series',xlab='time',ylab='value')
if (par8=='') {
mytitle <- paste('Working Time Series (lambda=',par2,', d=',par3,', D=',par4,')',sep='')
mysub <- paste('(lambda=',par2,', d=',par3,', D=',par4,', CI=', par7, ', CI type=',par6,')',sep='')
} else {
mytitle <- paste('Working Time Series (base=',par8,', d=',par3,', D=',par4,')',sep='')
mysub <- paste('(base=',par8,', d=',par3,', D=',par4,', CI=', par7, ', CI type=',par6,')',sep='')
}
plot(x,type='l', main=mytitle,xlab='time',ylab='value')
par(op)
dev.off()
bitmap(file='pic1.png')
racf <- acf(x, par1, main='Autocorrelation', xlab='time lag', ylab='ACF', ci.type=par6, ci=par7, sub=mysub)
dev.off()
bitmap(file='pic2.png')
rpacf <- pacf(x,par1,main='Partial Autocorrelation',xlab='lags',ylab='PACF',sub=mysub)
dev.off()
(myacf <- c(racf$acf))
(mypacf <- c(rpacf$acf))
lengthx <- length(x)
sqrtn <- sqrt(lengthx)
load(file='createtable')
a<-table.start()
a<-table.row.start(a)
a<-table.element(a,'Autocorrelation Function',4,TRUE)
a<-table.row.end(a)
a<-table.row.start(a)
a<-table.element(a,'Time lag k',header=TRUE)
a<-table.element(a,'ACF(k)',header=TRUE)
a<-table.element(a,'T-STAT',header=TRUE)
a<-table.element(a,'P-value',header=TRUE)
a<-table.row.end(a)
for (i in 2:(par1+1)) {
a<-table.row.start(a)
a<-table.element(a,i-1,header=TRUE)
a<-table.element(a,round(myacf[i],6))
mytstat <- myacf[i]*sqrtn
a<-table.element(a,round(mytstat,4))
a<-table.element(a,round(1-pt(abs(mytstat),lengthx),6))
a<-table.row.end(a)
}
a<-table.end(a)
table.save(a,file='mytable.tab')
a<-table.start()
a<-table.row.start(a)
a<-table.element(a,'Partial Autocorrelation Function',4,TRUE)
a<-table.row.end(a)
a<-table.row.start(a)
a<-table.element(a,'Time lag k',header=TRUE)
a<-table.element(a,'PACF(k)',header=TRUE)
a<-table.element(a,'T-STAT',header=TRUE)
a<-table.element(a,'P-value',header=TRUE)
a<-table.row.end(a)
for (i in 1:par1) {
a<-table.row.start(a)
a<-table.element(a,i,header=TRUE)
a<-table.element(a,round(mypacf[i],6))
mytstat <- mypacf[i]*sqrtn
a<-table.element(a,round(mytstat,4))
a<-table.element(a,round(1-pt(abs(mytstat),lengthx),6))
a<-table.row.end(a)
}
a<-table.end(a)
table.save(a,file='mytable1.tab')