Free Statistics

of Irreproducible Research!

Author's title

Author*Unverified author*
R Software Modulerwasp_autocorrelation.wasp
Title produced by software(Partial) Autocorrelation Function
Date of computationSun, 24 Nov 2019 20:53:16 +0100
Cite this page as followsStatistical Computations at FreeStatistics.org, Office for Research Development and Education, URL https://freestatistics.org/blog/index.php?v=date/2019/Nov/24/t1574626596tdaomkxsnxinofj.htm/, Retrieved Fri, 17 May 2024 05:20:28 +0000
Statistical Computations at FreeStatistics.org, Office for Research Development and Education, URL https://freestatistics.org/blog/index.php?pk=318950, Retrieved Fri, 17 May 2024 05:20:28 +0000
QR Codes:

Original text written by user:
IsPrivate?No (this computation is public)
User-defined keywords
Estimated Impact107
Family? (F = Feedback message, R = changed R code, M = changed R Module, P = changed Parameters, D = changed Data)
-       [(Partial) Autocorrelation Function] [] [2019-11-24 19:53:16] [d41d8cd98f00b204e9800998ecf8427e] [Current]
Feedback Forum

Post a new message
Dataseries X:
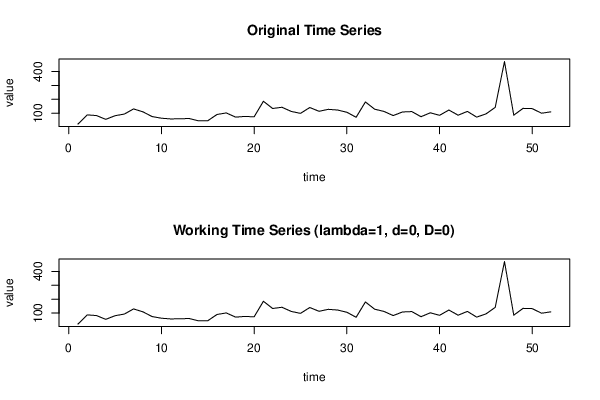
22
88
83
56
82
94
131
110
76
64
59
60
62
45
46
91
102
72
77
74
186
134
143
113
99
141
114
128
123
107
71
181
129
113
83
109
112
75
103
85
123
86
113
72
95
142
472
86
135
133
100
110


Summary of computational transaction
Raw Input view raw input (R code)
Raw Outputview raw output of R engine
Computing time1 seconds
R ServerBig Analytics Cloud Computing Center

\begin{tabular}{lllllllll}
\hline
Summary of computational transaction \tabularnewline
Raw Input view raw input (R code)  \tabularnewline
Raw Outputview raw output of R engine  \tabularnewline
Computing time1 seconds \tabularnewline
R ServerBig Analytics Cloud Computing Center \tabularnewline
\hline
\end{tabular}
%Source: https://freestatistics.org/blog/index.php?pk=318950&T=0

[TABLE]
[ROW]
Summary of computational transaction[/C][/ROW] [ROW]Raw Input[/C] view raw input (R code) [/C][/ROW] [ROW]Raw Output[/C]view raw output of R engine [/C][/ROW] [ROW]Computing time[/C]1 seconds[/C][/ROW] [ROW]R Server[/C]Big Analytics Cloud Computing Center[/C][/ROW] [/TABLE] Source: https://freestatistics.org/blog/index.php?pk=318950&T=0

Globally Unique Identifier (entire table): ba.freestatistics.org/blog/index.php?pk=318950&T=0

As an alternative you can also use a QR Code:  

The GUIDs for individual cells are displayed in the table below:

Summary of computational transaction
Raw Input view raw input (R code)
Raw Outputview raw output of R engine
Computing time1 seconds
R ServerBig Analytics Cloud Computing Center


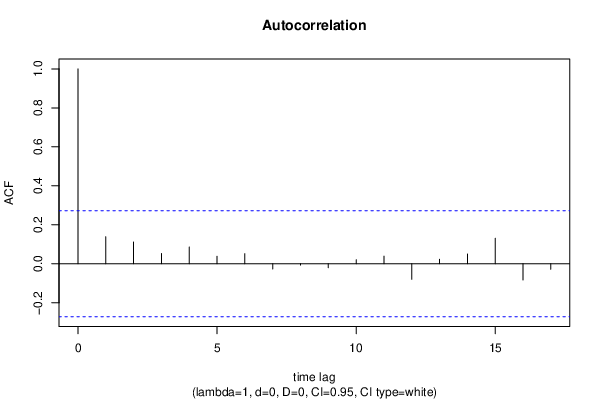
Autocorrelation Function
Time lag kACF(k)T-STATP-value
10.1379650.99490.162202
20.1110050.80050.213541
30.0522450.37670.353949
40.0852550.61480.27069
50.0381670.27520.392116
60.0515680.37190.355754
7-0.027147-0.19580.422782
8-0.00684-0.04930.480424
9-0.020105-0.1450.442643
100.020170.14550.442459
110.0388630.28020.390201
12-0.080385-0.57970.282322
130.0230560.16630.4343
140.0498970.35980.360223
150.1306470.94210.175247
16-0.083559-0.60260.274713
17-0.028004-0.20190.420377

\begin{tabular}{lllllllll}
\hline
Autocorrelation Function \tabularnewline
Time lag k & ACF(k) & T-STAT & P-value \tabularnewline
1 & 0.137965 & 0.9949 & 0.162202 \tabularnewline
2 & 0.111005 & 0.8005 & 0.213541 \tabularnewline
3 & 0.052245 & 0.3767 & 0.353949 \tabularnewline
4 & 0.085255 & 0.6148 & 0.27069 \tabularnewline
5 & 0.038167 & 0.2752 & 0.392116 \tabularnewline
6 & 0.051568 & 0.3719 & 0.355754 \tabularnewline
7 & -0.027147 & -0.1958 & 0.422782 \tabularnewline
8 & -0.00684 & -0.0493 & 0.480424 \tabularnewline
9 & -0.020105 & -0.145 & 0.442643 \tabularnewline
10 & 0.02017 & 0.1455 & 0.442459 \tabularnewline
11 & 0.038863 & 0.2802 & 0.390201 \tabularnewline
12 & -0.080385 & -0.5797 & 0.282322 \tabularnewline
13 & 0.023056 & 0.1663 & 0.4343 \tabularnewline
14 & 0.049897 & 0.3598 & 0.360223 \tabularnewline
15 & 0.130647 & 0.9421 & 0.175247 \tabularnewline
16 & -0.083559 & -0.6026 & 0.274713 \tabularnewline
17 & -0.028004 & -0.2019 & 0.420377 \tabularnewline
\hline
\end{tabular}
%Source: https://freestatistics.org/blog/index.php?pk=318950&T=1

[TABLE]
[ROW][C]Autocorrelation Function[/C][/ROW]
[ROW][C]Time lag k[/C][C]ACF(k)[/C][C]T-STAT[/C][C]P-value[/C][/ROW]
[ROW][C]1[/C][C]0.137965[/C][C]0.9949[/C][C]0.162202[/C][/ROW]
[ROW][C]2[/C][C]0.111005[/C][C]0.8005[/C][C]0.213541[/C][/ROW]
[ROW][C]3[/C][C]0.052245[/C][C]0.3767[/C][C]0.353949[/C][/ROW]
[ROW][C]4[/C][C]0.085255[/C][C]0.6148[/C][C]0.27069[/C][/ROW]
[ROW][C]5[/C][C]0.038167[/C][C]0.2752[/C][C]0.392116[/C][/ROW]
[ROW][C]6[/C][C]0.051568[/C][C]0.3719[/C][C]0.355754[/C][/ROW]
[ROW][C]7[/C][C]-0.027147[/C][C]-0.1958[/C][C]0.422782[/C][/ROW]
[ROW][C]8[/C][C]-0.00684[/C][C]-0.0493[/C][C]0.480424[/C][/ROW]
[ROW][C]9[/C][C]-0.020105[/C][C]-0.145[/C][C]0.442643[/C][/ROW]
[ROW][C]10[/C][C]0.02017[/C][C]0.1455[/C][C]0.442459[/C][/ROW]
[ROW][C]11[/C][C]0.038863[/C][C]0.2802[/C][C]0.390201[/C][/ROW]
[ROW][C]12[/C][C]-0.080385[/C][C]-0.5797[/C][C]0.282322[/C][/ROW]
[ROW][C]13[/C][C]0.023056[/C][C]0.1663[/C][C]0.4343[/C][/ROW]
[ROW][C]14[/C][C]0.049897[/C][C]0.3598[/C][C]0.360223[/C][/ROW]
[ROW][C]15[/C][C]0.130647[/C][C]0.9421[/C][C]0.175247[/C][/ROW]
[ROW][C]16[/C][C]-0.083559[/C][C]-0.6026[/C][C]0.274713[/C][/ROW]
[ROW][C]17[/C][C]-0.028004[/C][C]-0.2019[/C][C]0.420377[/C][/ROW]
[/TABLE]
Source: https://freestatistics.org/blog/index.php?pk=318950&T=1

Globally Unique Identifier (entire table): ba.freestatistics.org/blog/index.php?pk=318950&T=1

As an alternative you can also use a QR Code:  

The GUIDs for individual cells are displayed in the table below:

Autocorrelation Function
Time lag kACF(k)T-STATP-value
10.1379650.99490.162202
20.1110050.80050.213541
30.0522450.37670.353949
40.0852550.61480.27069
50.0381670.27520.392116
60.0515680.37190.355754
7-0.027147-0.19580.422782
8-0.00684-0.04930.480424
9-0.020105-0.1450.442643
100.020170.14550.442459
110.0388630.28020.390201
12-0.080385-0.57970.282322
130.0230560.16630.4343
140.0498970.35980.360223
150.1306470.94210.175247
16-0.083559-0.60260.274713
17-0.028004-0.20190.420377


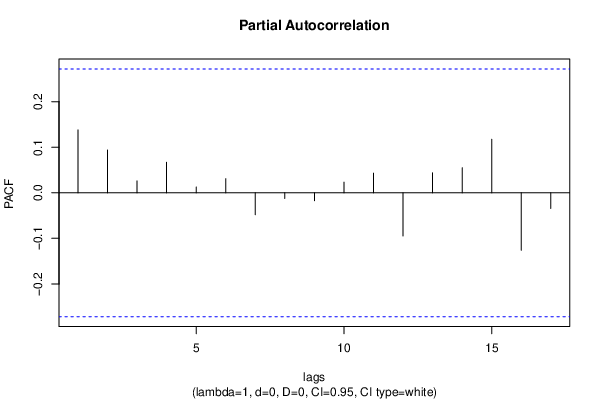
Partial Autocorrelation Function
Time lag kPACF(k)T-STATP-value
10.1379650.99490.162202
20.0937550.67610.250994
30.0261540.18860.425569
40.0670980.48390.31526
50.0126220.0910.463915
60.0309260.2230.412201
7-0.04801-0.34620.365293
8-0.012557-0.09060.464098
9-0.017317-0.12490.450551
100.0233270.16820.433533
110.042990.310.378898
12-0.09475-0.68330.24874
130.0440290.31750.37607
140.0549570.39630.346753
150.1173140.8460.200724
16-0.125984-0.90850.183907
17-0.034237-0.24690.402984

\begin{tabular}{lllllllll}
\hline
Partial Autocorrelation Function \tabularnewline
Time lag k & PACF(k) & T-STAT & P-value \tabularnewline
1 & 0.137965 & 0.9949 & 0.162202 \tabularnewline
2 & 0.093755 & 0.6761 & 0.250994 \tabularnewline
3 & 0.026154 & 0.1886 & 0.425569 \tabularnewline
4 & 0.067098 & 0.4839 & 0.31526 \tabularnewline
5 & 0.012622 & 0.091 & 0.463915 \tabularnewline
6 & 0.030926 & 0.223 & 0.412201 \tabularnewline
7 & -0.04801 & -0.3462 & 0.365293 \tabularnewline
8 & -0.012557 & -0.0906 & 0.464098 \tabularnewline
9 & -0.017317 & -0.1249 & 0.450551 \tabularnewline
10 & 0.023327 & 0.1682 & 0.433533 \tabularnewline
11 & 0.04299 & 0.31 & 0.378898 \tabularnewline
12 & -0.09475 & -0.6833 & 0.24874 \tabularnewline
13 & 0.044029 & 0.3175 & 0.37607 \tabularnewline
14 & 0.054957 & 0.3963 & 0.346753 \tabularnewline
15 & 0.117314 & 0.846 & 0.200724 \tabularnewline
16 & -0.125984 & -0.9085 & 0.183907 \tabularnewline
17 & -0.034237 & -0.2469 & 0.402984 \tabularnewline
\hline
\end{tabular}
%Source: https://freestatistics.org/blog/index.php?pk=318950&T=2

[TABLE]
[ROW][C]Partial Autocorrelation Function[/C][/ROW]
[ROW][C]Time lag k[/C][C]PACF(k)[/C][C]T-STAT[/C][C]P-value[/C][/ROW]
[ROW][C]1[/C][C]0.137965[/C][C]0.9949[/C][C]0.162202[/C][/ROW]
[ROW][C]2[/C][C]0.093755[/C][C]0.6761[/C][C]0.250994[/C][/ROW]
[ROW][C]3[/C][C]0.026154[/C][C]0.1886[/C][C]0.425569[/C][/ROW]
[ROW][C]4[/C][C]0.067098[/C][C]0.4839[/C][C]0.31526[/C][/ROW]
[ROW][C]5[/C][C]0.012622[/C][C]0.091[/C][C]0.463915[/C][/ROW]
[ROW][C]6[/C][C]0.030926[/C][C]0.223[/C][C]0.412201[/C][/ROW]
[ROW][C]7[/C][C]-0.04801[/C][C]-0.3462[/C][C]0.365293[/C][/ROW]
[ROW][C]8[/C][C]-0.012557[/C][C]-0.0906[/C][C]0.464098[/C][/ROW]
[ROW][C]9[/C][C]-0.017317[/C][C]-0.1249[/C][C]0.450551[/C][/ROW]
[ROW][C]10[/C][C]0.023327[/C][C]0.1682[/C][C]0.433533[/C][/ROW]
[ROW][C]11[/C][C]0.04299[/C][C]0.31[/C][C]0.378898[/C][/ROW]
[ROW][C]12[/C][C]-0.09475[/C][C]-0.6833[/C][C]0.24874[/C][/ROW]
[ROW][C]13[/C][C]0.044029[/C][C]0.3175[/C][C]0.37607[/C][/ROW]
[ROW][C]14[/C][C]0.054957[/C][C]0.3963[/C][C]0.346753[/C][/ROW]
[ROW][C]15[/C][C]0.117314[/C][C]0.846[/C][C]0.200724[/C][/ROW]
[ROW][C]16[/C][C]-0.125984[/C][C]-0.9085[/C][C]0.183907[/C][/ROW]
[ROW][C]17[/C][C]-0.034237[/C][C]-0.2469[/C][C]0.402984[/C][/ROW]
[/TABLE]
Source: https://freestatistics.org/blog/index.php?pk=318950&T=2

Globally Unique Identifier (entire table): ba.freestatistics.org/blog/index.php?pk=318950&T=2

As an alternative you can also use a QR Code:  

The GUIDs for individual cells are displayed in the table below:

Partial Autocorrelation Function
Time lag kPACF(k)T-STATP-value
10.1379650.99490.162202
20.0937550.67610.250994
30.0261540.18860.425569
40.0670980.48390.31526
50.0126220.0910.463915
60.0309260.2230.412201
7-0.04801-0.34620.365293
8-0.012557-0.09060.464098
9-0.017317-0.12490.450551
100.0233270.16820.433533
110.042990.310.378898
12-0.09475-0.68330.24874
130.0440290.31750.37607
140.0549570.39630.346753
150.1173140.8460.200724
16-0.125984-0.90850.183907
17-0.034237-0.24690.402984


Parameters (Session):
par1 = Default ; par2 = 1 ; par3 = 0 ; par4 = 0 ; par5 = 12 ; par6 = White Noise ; par7 = 0.95 ;
Parameters (R input):
par1 = Default ; par2 = 1 ; par3 = 0 ; par4 = 0 ; par5 = 12 ; par6 = White Noise ; par7 = 0.95 ; par8 = ;
R code (references can be found in the software module):
if (par1 == 'Default') {
par1 = 10*log10(length(x))
} else {
par1 <- as.numeric(par1)
}
par2 <- as.numeric(par2)
par3 <- as.numeric(par3)
par4 <- as.numeric(par4)
par5 <- as.numeric(par5)
if (par6 == 'White Noise') par6 <- 'white' else par6 <- 'ma'
par7 <- as.numeric(par7)
if (par8 != '') par8 <- as.numeric(par8)
x <- na.omit(x)
ox <- x
if (par8 == '') {
if (par2 == 0) {
x <- log(x)
} else {
x <- (x ^ par2 - 1) / par2
}
} else {
x <- log(x,base=par8)
}
if (par3 > 0) x <- diff(x,lag=1,difference=par3)
if (par4 > 0) x <- diff(x,lag=par5,difference=par4)
bitmap(file='picts.png')
op <- par(mfrow=c(2,1))
plot(ox,type='l',main='Original Time Series',xlab='time',ylab='value')
if (par8=='') {
mytitle <- paste('Working Time Series (lambda=',par2,', d=',par3,', D=',par4,')',sep='')
mysub <- paste('(lambda=',par2,', d=',par3,', D=',par4,', CI=', par7, ', CI type=',par6,')',sep='')
} else {
mytitle <- paste('Working Time Series (base=',par8,', d=',par3,', D=',par4,')',sep='')
mysub <- paste('(base=',par8,', d=',par3,', D=',par4,', CI=', par7, ', CI type=',par6,')',sep='')
}
plot(x,type='l', main=mytitle,xlab='time',ylab='value')
par(op)
dev.off()
bitmap(file='pic1.png')
racf <- acf(x, par1, main='Autocorrelation', xlab='time lag', ylab='ACF', ci.type=par6, ci=par7, sub=mysub)
dev.off()
bitmap(file='pic2.png')
rpacf <- pacf(x,par1,main='Partial Autocorrelation',xlab='lags',ylab='PACF',sub=mysub)
dev.off()
(myacf <- c(racf$acf))
(mypacf <- c(rpacf$acf))
lengthx <- length(x)
sqrtn <- sqrt(lengthx)
load(file='createtable')
a<-table.start()
a<-table.row.start(a)
a<-table.element(a,'Autocorrelation Function',4,TRUE)
a<-table.row.end(a)
a<-table.row.start(a)
a<-table.element(a,'Time lag k',header=TRUE)
a<-table.element(a,'ACF(k)',header=TRUE)
a<-table.element(a,'T-STAT',header=TRUE)
a<-table.element(a,'P-value',header=TRUE)
a<-table.row.end(a)
for (i in 2:(par1+1)) {
a<-table.row.start(a)
a<-table.element(a,i-1,header=TRUE)
a<-table.element(a,round(myacf[i],6))
mytstat <- myacf[i]*sqrtn
a<-table.element(a,round(mytstat,4))
a<-table.element(a,round(1-pt(abs(mytstat),lengthx),6))
a<-table.row.end(a)
}
a<-table.end(a)
table.save(a,file='mytable.tab')
a<-table.start()
a<-table.row.start(a)
a<-table.element(a,'Partial Autocorrelation Function',4,TRUE)
a<-table.row.end(a)
a<-table.row.start(a)
a<-table.element(a,'Time lag k',header=TRUE)
a<-table.element(a,'PACF(k)',header=TRUE)
a<-table.element(a,'T-STAT',header=TRUE)
a<-table.element(a,'P-value',header=TRUE)
a<-table.row.end(a)
for (i in 1:par1) {
a<-table.row.start(a)
a<-table.element(a,i,header=TRUE)
a<-table.element(a,round(mypacf[i],6))
mytstat <- mypacf[i]*sqrtn
a<-table.element(a,round(mytstat,4))
a<-table.element(a,round(1-pt(abs(mytstat),lengthx),6))
a<-table.row.end(a)
}
a<-table.end(a)
table.save(a,file='mytable1.tab')