Free Statistics

of Irreproducible Research!

Author's title

Author*Unverified author*
R Software Modulerwasp_summary1.wasp
Title produced by softwareUnivariate Summary Statistics
Date of computationTue, 26 Feb 2019 08:51:30 +0100
Cite this page as followsStatistical Computations at FreeStatistics.org, Office for Research Development and Education, URL https://freestatistics.org/blog/index.php?v=date/2019/Feb/26/t1551167569ttqekw0m611n0qq.htm/, Retrieved Sat, 18 May 2024 12:51:31 +0000
Statistical Computations at FreeStatistics.org, Office for Research Development and Education, URL https://freestatistics.org/blog/index.php?pk=318747, Retrieved Sat, 18 May 2024 12:51:31 +0000
QR Codes:

Original text written by user:
IsPrivate?No (this computation is public)
User-defined keywords
Estimated Impact135
Family? (F = Feedback message, R = changed R code, M = changed R Module, P = changed Parameters, D = changed Data)
-       [Univariate Summary Statistics] [] [2019-02-26 07:51:30] [d41d8cd98f00b204e9800998ecf8427e] [Current]
Feedback Forum

Post a new message
Dataseries X:
39,0810
38,9520
38,9470
38,9550
38,9380
38,9520
38,9520
38,9290
38,9740
38,9350
38,9430
38,9820
38,9820
38,9610
38,9210
38,9080
38,9520
38,9740
38,9580
38,9300
38,9550
38,9370


Summary of computational transaction
Raw Input view raw input (R code)
Raw Outputview raw output of R engine
Computing time1 seconds
R ServerBig Analytics Cloud Computing Center

\begin{tabular}{lllllllll}
\hline
Summary of computational transaction \tabularnewline
Raw Input view raw input (R code)  \tabularnewline
Raw Outputview raw output of R engine  \tabularnewline
Computing time1 seconds \tabularnewline
R ServerBig Analytics Cloud Computing Center \tabularnewline
\hline
\end{tabular}
%Source: https://freestatistics.org/blog/index.php?pk=318747&T=0

[TABLE]
[ROW]
Summary of computational transaction[/C][/ROW] [ROW]Raw Input[/C] view raw input (R code) [/C][/ROW] [ROW]Raw Output[/C]view raw output of R engine [/C][/ROW] [ROW]Computing time[/C]1 seconds[/C][/ROW] [ROW]R Server[/C]Big Analytics Cloud Computing Center[/C][/ROW] [/TABLE] Source: https://freestatistics.org/blog/index.php?pk=318747&T=0

Globally Unique Identifier (entire table): ba.freestatistics.org/blog/index.php?pk=318747&T=0

As an alternative you can also use a QR Code:  

The GUIDs for individual cells are displayed in the table below:

Summary of computational transaction
Raw Input view raw input (R code)
Raw Outputview raw output of R engine
Computing time1 seconds
R ServerBig Analytics Cloud Computing Center


Central Tendency - Ungrouped Data
MeasureValueS.E.Value/S.E.
Arithmetic Mean38.95540.007210675402.46
Geometric Mean38.9553
Harmonic Mean38.9553
Quadratic Mean38.9554
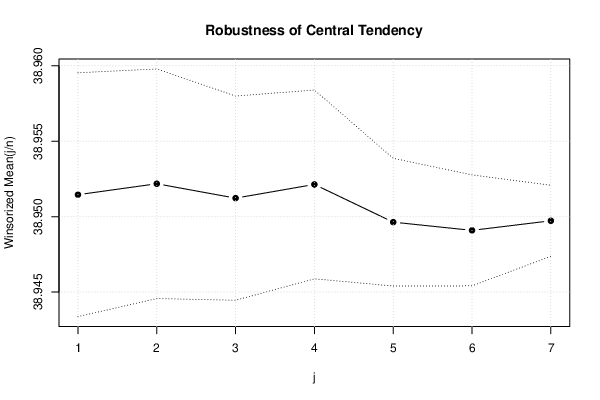
Winsorized Mean ( 1 / 7 )38.95150.004041849637.06
Winsorized Mean ( 2 / 7 )38.95220.0038051210236.8
Winsorized Mean ( 3 / 7 )38.95120.0033850511506.8
Winsorized Mean ( 4 / 7 )38.95210.0031301512444.2
Winsorized Mean ( 5 / 7 )38.94960.0021162618404.9
Winsorized Mean ( 6 / 7 )38.94910.0018386321183.8
Winsorized Mean ( 7 / 7 )38.94970.0011773133083.5
Trimmed Mean ( 1 / 7 )38.95140.0038685510068.8
Trimmed Mean ( 2 / 7 )38.95140.003536211015.1
Trimmed Mean ( 3 / 7 )38.95090.0031523412356.2
Trimmed Mean ( 4 / 7 )38.95080.0027876913972.4
Trimmed Mean ( 5 / 7 )38.95020.0021701617948.1
Trimmed Mean ( 6 / 7 )38.95040.0019160120328.9
Trimmed Mean ( 7 / 7 )38.9510.0014392527063.5
Median38.952
Midrange38.9945
Midmean - Weighted Average at Xnp38.9492
Midmean - Weighted Average at X(n+1)p38.9502
Midmean - Empirical Distribution Function38.9502
Midmean - Empirical Distribution Function - Averaging38.9502
Midmean - Empirical Distribution Function - Interpolation38.9504
Midmean - Closest Observation38.9502
Midmean - True Basic - Statistics Graphics Toolkit38.9502
Midmean - MS Excel (old versions)38.9502
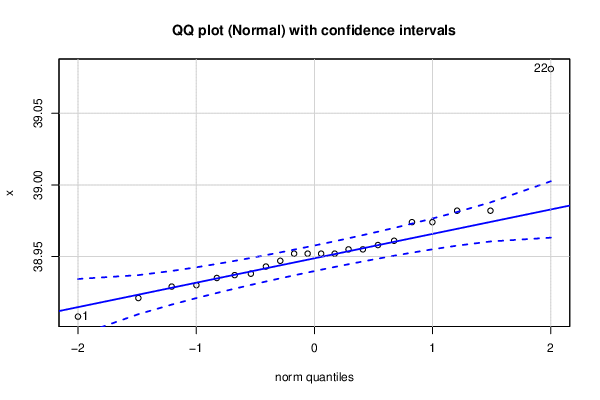
Number of observations22

\begin{tabular}{lllllllll}
\hline
Central Tendency - Ungrouped Data \tabularnewline
Measure & Value & S.E. & Value/S.E. \tabularnewline
Arithmetic Mean & 38.9554 & 0.00721067 & 5402.46 \tabularnewline
Geometric Mean & 38.9553 &  &  \tabularnewline
Harmonic Mean & 38.9553 &  &  \tabularnewline
Quadratic Mean & 38.9554 &  &  \tabularnewline
Winsorized Mean ( 1 / 7 ) & 38.9515 & 0.00404184 & 9637.06 \tabularnewline
Winsorized Mean ( 2 / 7 ) & 38.9522 & 0.00380512 & 10236.8 \tabularnewline
Winsorized Mean ( 3 / 7 ) & 38.9512 & 0.00338505 & 11506.8 \tabularnewline
Winsorized Mean ( 4 / 7 ) & 38.9521 & 0.00313015 & 12444.2 \tabularnewline
Winsorized Mean ( 5 / 7 ) & 38.9496 & 0.00211626 & 18404.9 \tabularnewline
Winsorized Mean ( 6 / 7 ) & 38.9491 & 0.00183863 & 21183.8 \tabularnewline
Winsorized Mean ( 7 / 7 ) & 38.9497 & 0.00117731 & 33083.5 \tabularnewline
Trimmed Mean ( 1 / 7 ) & 38.9514 & 0.00386855 & 10068.8 \tabularnewline
Trimmed Mean ( 2 / 7 ) & 38.9514 & 0.0035362 & 11015.1 \tabularnewline
Trimmed Mean ( 3 / 7 ) & 38.9509 & 0.00315234 & 12356.2 \tabularnewline
Trimmed Mean ( 4 / 7 ) & 38.9508 & 0.00278769 & 13972.4 \tabularnewline
Trimmed Mean ( 5 / 7 ) & 38.9502 & 0.00217016 & 17948.1 \tabularnewline
Trimmed Mean ( 6 / 7 ) & 38.9504 & 0.00191601 & 20328.9 \tabularnewline
Trimmed Mean ( 7 / 7 ) & 38.951 & 0.00143925 & 27063.5 \tabularnewline
Median & 38.952 &  &  \tabularnewline
Midrange & 38.9945 &  &  \tabularnewline
Midmean - Weighted Average at Xnp & 38.9492 &  &  \tabularnewline
Midmean - Weighted Average at X(n+1)p & 38.9502 &  &  \tabularnewline
Midmean - Empirical Distribution Function & 38.9502 &  &  \tabularnewline
Midmean - Empirical Distribution Function - Averaging & 38.9502 &  &  \tabularnewline
Midmean - Empirical Distribution Function - Interpolation & 38.9504 &  &  \tabularnewline
Midmean - Closest Observation & 38.9502 &  &  \tabularnewline
Midmean - True Basic - Statistics Graphics Toolkit & 38.9502 &  &  \tabularnewline
Midmean - MS Excel (old versions) & 38.9502 &  &  \tabularnewline
Number of observations & 22 &  &  \tabularnewline
\hline
\end{tabular}
%Source: https://freestatistics.org/blog/index.php?pk=318747&T=1

[TABLE]
[ROW][C]Central Tendency - Ungrouped Data[/C][/ROW]
[ROW][C]Measure[/C][C]Value[/C][C]S.E.[/C][C]Value/S.E.[/C][/ROW]
[ROW][C]Arithmetic Mean[/C][C]38.9554[/C][C]0.00721067[/C][C]5402.46[/C][/ROW]
[ROW][C]Geometric Mean[/C][C]38.9553[/C][C][/C][C][/C][/ROW]
[ROW][C]Harmonic Mean[/C][C]38.9553[/C][C][/C][C][/C][/ROW]
[ROW][C]Quadratic Mean[/C][C]38.9554[/C][C][/C][C][/C][/ROW]
[ROW][C]Winsorized Mean ( 1 / 7 )[/C][C]38.9515[/C][C]0.00404184[/C][C]9637.06[/C][/ROW]
[ROW][C]Winsorized Mean ( 2 / 7 )[/C][C]38.9522[/C][C]0.00380512[/C][C]10236.8[/C][/ROW]
[ROW][C]Winsorized Mean ( 3 / 7 )[/C][C]38.9512[/C][C]0.00338505[/C][C]11506.8[/C][/ROW]
[ROW][C]Winsorized Mean ( 4 / 7 )[/C][C]38.9521[/C][C]0.00313015[/C][C]12444.2[/C][/ROW]
[ROW][C]Winsorized Mean ( 5 / 7 )[/C][C]38.9496[/C][C]0.00211626[/C][C]18404.9[/C][/ROW]
[ROW][C]Winsorized Mean ( 6 / 7 )[/C][C]38.9491[/C][C]0.00183863[/C][C]21183.8[/C][/ROW]
[ROW][C]Winsorized Mean ( 7 / 7 )[/C][C]38.9497[/C][C]0.00117731[/C][C]33083.5[/C][/ROW]
[ROW][C]Trimmed Mean ( 1 / 7 )[/C][C]38.9514[/C][C]0.00386855[/C][C]10068.8[/C][/ROW]
[ROW][C]Trimmed Mean ( 2 / 7 )[/C][C]38.9514[/C][C]0.0035362[/C][C]11015.1[/C][/ROW]
[ROW][C]Trimmed Mean ( 3 / 7 )[/C][C]38.9509[/C][C]0.00315234[/C][C]12356.2[/C][/ROW]
[ROW][C]Trimmed Mean ( 4 / 7 )[/C][C]38.9508[/C][C]0.00278769[/C][C]13972.4[/C][/ROW]
[ROW][C]Trimmed Mean ( 5 / 7 )[/C][C]38.9502[/C][C]0.00217016[/C][C]17948.1[/C][/ROW]
[ROW][C]Trimmed Mean ( 6 / 7 )[/C][C]38.9504[/C][C]0.00191601[/C][C]20328.9[/C][/ROW]
[ROW][C]Trimmed Mean ( 7 / 7 )[/C][C]38.951[/C][C]0.00143925[/C][C]27063.5[/C][/ROW]
[ROW][C]Median[/C][C]38.952[/C][C][/C][C][/C][/ROW]
[ROW][C]Midrange[/C][C]38.9945[/C][C][/C][C][/C][/ROW]
[ROW][C]Midmean - Weighted Average at Xnp[/C][C]38.9492[/C][C][/C][C][/C][/ROW]
[ROW][C]Midmean - Weighted Average at X(n+1)p[/C][C]38.9502[/C][C][/C][C][/C][/ROW]
[ROW][C]Midmean - Empirical Distribution Function[/C][C]38.9502[/C][C][/C][C][/C][/ROW]
[ROW][C]Midmean - Empirical Distribution Function - Averaging[/C][C]38.9502[/C][C][/C][C][/C][/ROW]
[ROW][C]Midmean - Empirical Distribution Function - Interpolation[/C][C]38.9504[/C][C][/C][C][/C][/ROW]
[ROW][C]Midmean - Closest Observation[/C][C]38.9502[/C][C][/C][C][/C][/ROW]
[ROW][C]Midmean - True Basic - Statistics Graphics Toolkit[/C][C]38.9502[/C][C][/C][C][/C][/ROW]
[ROW][C]Midmean - MS Excel (old versions)[/C][C]38.9502[/C][C][/C][C][/C][/ROW]
[ROW][C]Number of observations[/C][C]22[/C][C][/C][C][/C][/ROW]
[/TABLE]
Source: https://freestatistics.org/blog/index.php?pk=318747&T=1

Globally Unique Identifier (entire table): ba.freestatistics.org/blog/index.php?pk=318747&T=1

As an alternative you can also use a QR Code:  

The GUIDs for individual cells are displayed in the table below:

Central Tendency - Ungrouped Data
MeasureValueS.E.Value/S.E.
Arithmetic Mean38.95540.007210675402.46
Geometric Mean38.9553
Harmonic Mean38.9553
Quadratic Mean38.9554
Winsorized Mean ( 1 / 7 )38.95150.004041849637.06
Winsorized Mean ( 2 / 7 )38.95220.0038051210236.8
Winsorized Mean ( 3 / 7 )38.95120.0033850511506.8
Winsorized Mean ( 4 / 7 )38.95210.0031301512444.2
Winsorized Mean ( 5 / 7 )38.94960.0021162618404.9
Winsorized Mean ( 6 / 7 )38.94910.0018386321183.8
Winsorized Mean ( 7 / 7 )38.94970.0011773133083.5
Trimmed Mean ( 1 / 7 )38.95140.0038685510068.8
Trimmed Mean ( 2 / 7 )38.95140.003536211015.1
Trimmed Mean ( 3 / 7 )38.95090.0031523412356.2
Trimmed Mean ( 4 / 7 )38.95080.0027876913972.4
Trimmed Mean ( 5 / 7 )38.95020.0021701617948.1
Trimmed Mean ( 6 / 7 )38.95040.0019160120328.9
Trimmed Mean ( 7 / 7 )38.9510.0014392527063.5
Median38.952
Midrange38.9945
Midmean - Weighted Average at Xnp38.9492
Midmean - Weighted Average at X(n+1)p38.9502
Midmean - Empirical Distribution Function38.9502
Midmean - Empirical Distribution Function - Averaging38.9502
Midmean - Empirical Distribution Function - Interpolation38.9504
Midmean - Closest Observation38.9502
Midmean - True Basic - Statistics Graphics Toolkit38.9502
Midmean - MS Excel (old versions)38.9502
Number of observations22


Variability - Ungrouped Data
Absolute range0.173
Relative range (unbiased)5.11516
Relative range (biased)5.23554
Variance (unbiased)0.00114386
Variance (biased)0.00109187
Standard Deviation (unbiased)0.033821
Standard Deviation (biased)0.0330434
Coefficient of Variation (unbiased)0.000868199
Coefficient of Variation (biased)0.000848238
Mean Squared Error (MSE versus 0)1517.52
Mean Squared Error (MSE versus Mean)0.00109187
Mean Absolute Deviation from Mean (MAD Mean)0.020405
Mean Absolute Deviation from Median (MAD Median)0.0197273
Median Absolute Deviation from Mean0.0178636
Median Absolute Deviation from Median0.0145
Mean Squared Deviation from Mean0.00109187
Mean Squared Deviation from Median0.00110318
Interquartile Difference (Weighted Average at Xnp)0.0235
Interquartile Difference (Weighted Average at X(n+1)p)0.02775
Interquartile Difference (Empirical Distribution Function)0.024
Interquartile Difference (Empirical Distribution Function - Averaging)0.024
Interquartile Difference (Empirical Distribution Function - Interpolation)0.023
Interquartile Difference (Closest Observation)0.024
Interquartile Difference (True Basic - Statistics Graphics Toolkit)0.03525
Interquartile Difference (MS Excel (old versions))0.024
Semi Interquartile Difference (Weighted Average at Xnp)0.01175
Semi Interquartile Difference (Weighted Average at X(n+1)p)0.013875
Semi Interquartile Difference (Empirical Distribution Function)0.012
Semi Interquartile Difference (Empirical Distribution Function - Averaging)0.012
Semi Interquartile Difference (Empirical Distribution Function - Interpolation)0.0115
Semi Interquartile Difference (Closest Observation)0.012
Semi Interquartile Difference (True Basic - Statistics Graphics Toolkit)0.017625
Semi Interquartile Difference (MS Excel (old versions))0.012
Coefficient of Quartile Variation (Weighted Average at Xnp)0.000301686
Coefficient of Quartile Variation (Weighted Average at X(n+1)p)0.000356223
Coefficient of Quartile Variation (Empirical Distribution Function)0.000308095
Coefficient of Quartile Variation (Empirical Distribution Function - Averaging)0.000308095
Coefficient of Quartile Variation (Empirical Distribution Function - Interpolation)0.00029526
Coefficient of Quartile Variation (Closest Observation)0.000308095
Coefficient of Quartile Variation (True Basic - Statistics Graphics Toolkit)0.000452467
Coefficient of Quartile Variation (MS Excel (old versions))0.000308095
Number of all Pairs of Observations231
Squared Differences between all Pairs of Observations0.00228772
Mean Absolute Differences between all Pairs of Observations0.0321558
Gini Mean Difference0.0321558
Leik Measure of Dispersion0.523838
Index of Diversity0.954545
Index of Qualitative Variation1
Coefficient of Dispersion0.000523849
Observations22

\begin{tabular}{lllllllll}
\hline
Variability - Ungrouped Data \tabularnewline
Absolute range & 0.173 \tabularnewline
Relative range (unbiased) & 5.11516 \tabularnewline
Relative range (biased) & 5.23554 \tabularnewline
Variance (unbiased) & 0.00114386 \tabularnewline
Variance (biased) & 0.00109187 \tabularnewline
Standard Deviation (unbiased) & 0.033821 \tabularnewline
Standard Deviation (biased) & 0.0330434 \tabularnewline
Coefficient of Variation (unbiased) & 0.000868199 \tabularnewline
Coefficient of Variation (biased) & 0.000848238 \tabularnewline
Mean Squared Error (MSE versus 0) & 1517.52 \tabularnewline
Mean Squared Error (MSE versus Mean) & 0.00109187 \tabularnewline
Mean Absolute Deviation from Mean (MAD Mean) & 0.020405 \tabularnewline
Mean Absolute Deviation from Median (MAD Median) & 0.0197273 \tabularnewline
Median Absolute Deviation from Mean & 0.0178636 \tabularnewline
Median Absolute Deviation from Median & 0.0145 \tabularnewline
Mean Squared Deviation from Mean & 0.00109187 \tabularnewline
Mean Squared Deviation from Median & 0.00110318 \tabularnewline
Interquartile Difference (Weighted Average at Xnp) & 0.0235 \tabularnewline
Interquartile Difference (Weighted Average at X(n+1)p) & 0.02775 \tabularnewline
Interquartile Difference (Empirical Distribution Function) & 0.024 \tabularnewline
Interquartile Difference (Empirical Distribution Function - Averaging) & 0.024 \tabularnewline
Interquartile Difference (Empirical Distribution Function - Interpolation) & 0.023 \tabularnewline
Interquartile Difference (Closest Observation) & 0.024 \tabularnewline
Interquartile Difference (True Basic - Statistics Graphics Toolkit) & 0.03525 \tabularnewline
Interquartile Difference (MS Excel (old versions)) & 0.024 \tabularnewline
Semi Interquartile Difference (Weighted Average at Xnp) & 0.01175 \tabularnewline
Semi Interquartile Difference (Weighted Average at X(n+1)p) & 0.013875 \tabularnewline
Semi Interquartile Difference (Empirical Distribution Function) & 0.012 \tabularnewline
Semi Interquartile Difference (Empirical Distribution Function - Averaging) & 0.012 \tabularnewline
Semi Interquartile Difference (Empirical Distribution Function - Interpolation) & 0.0115 \tabularnewline
Semi Interquartile Difference (Closest Observation) & 0.012 \tabularnewline
Semi Interquartile Difference (True Basic - Statistics Graphics Toolkit) & 0.017625 \tabularnewline
Semi Interquartile Difference (MS Excel (old versions)) & 0.012 \tabularnewline
Coefficient of Quartile Variation (Weighted Average at Xnp) & 0.000301686 \tabularnewline
Coefficient of Quartile Variation (Weighted Average at X(n+1)p) & 0.000356223 \tabularnewline
Coefficient of Quartile Variation (Empirical Distribution Function) & 0.000308095 \tabularnewline
Coefficient of Quartile Variation (Empirical Distribution Function - Averaging) & 0.000308095 \tabularnewline
Coefficient of Quartile Variation (Empirical Distribution Function - Interpolation) & 0.00029526 \tabularnewline
Coefficient of Quartile Variation (Closest Observation) & 0.000308095 \tabularnewline
Coefficient of Quartile Variation (True Basic - Statistics Graphics Toolkit) & 0.000452467 \tabularnewline
Coefficient of Quartile Variation (MS Excel (old versions)) & 0.000308095 \tabularnewline
Number of all Pairs of Observations & 231 \tabularnewline
Squared Differences between all Pairs of Observations & 0.00228772 \tabularnewline
Mean Absolute Differences between all Pairs of Observations & 0.0321558 \tabularnewline
Gini Mean Difference & 0.0321558 \tabularnewline
Leik Measure of Dispersion & 0.523838 \tabularnewline
Index of Diversity & 0.954545 \tabularnewline
Index of Qualitative Variation & 1 \tabularnewline
Coefficient of Dispersion & 0.000523849 \tabularnewline
Observations & 22 \tabularnewline
\hline
\end{tabular}
%Source: https://freestatistics.org/blog/index.php?pk=318747&T=2

[TABLE]
[ROW][C]Variability - Ungrouped Data[/C][/ROW]
[ROW][C]Absolute range[/C][C]0.173[/C][/ROW]
[ROW][C]Relative range (unbiased)[/C][C]5.11516[/C][/ROW]
[ROW][C]Relative range (biased)[/C][C]5.23554[/C][/ROW]
[ROW][C]Variance (unbiased)[/C][C]0.00114386[/C][/ROW]
[ROW][C]Variance (biased)[/C][C]0.00109187[/C][/ROW]
[ROW][C]Standard Deviation (unbiased)[/C][C]0.033821[/C][/ROW]
[ROW][C]Standard Deviation (biased)[/C][C]0.0330434[/C][/ROW]
[ROW][C]Coefficient of Variation (unbiased)[/C][C]0.000868199[/C][/ROW]
[ROW][C]Coefficient of Variation (biased)[/C][C]0.000848238[/C][/ROW]
[ROW][C]Mean Squared Error (MSE versus 0)[/C][C]1517.52[/C][/ROW]
[ROW][C]Mean Squared Error (MSE versus Mean)[/C][C]0.00109187[/C][/ROW]
[ROW][C]Mean Absolute Deviation from Mean (MAD Mean)[/C][C]0.020405[/C][/ROW]
[ROW][C]Mean Absolute Deviation from Median (MAD Median)[/C][C]0.0197273[/C][/ROW]
[ROW][C]Median Absolute Deviation from Mean[/C][C]0.0178636[/C][/ROW]
[ROW][C]Median Absolute Deviation from Median[/C][C]0.0145[/C][/ROW]
[ROW][C]Mean Squared Deviation from Mean[/C][C]0.00109187[/C][/ROW]
[ROW][C]Mean Squared Deviation from Median[/C][C]0.00110318[/C][/ROW]
[ROW][C]Interquartile Difference (Weighted Average at Xnp)[/C][C]0.0235[/C][/ROW]
[ROW][C]Interquartile Difference (Weighted Average at X(n+1)p)[/C][C]0.02775[/C][/ROW]
[ROW][C]Interquartile Difference (Empirical Distribution Function)[/C][C]0.024[/C][/ROW]
[ROW][C]Interquartile Difference (Empirical Distribution Function - Averaging)[/C][C]0.024[/C][/ROW]
[ROW][C]Interquartile Difference (Empirical Distribution Function - Interpolation)[/C][C]0.023[/C][/ROW]
[ROW][C]Interquartile Difference (Closest Observation)[/C][C]0.024[/C][/ROW]
[ROW][C]Interquartile Difference (True Basic - Statistics Graphics Toolkit)[/C][C]0.03525[/C][/ROW]
[ROW][C]Interquartile Difference (MS Excel (old versions))[/C][C]0.024[/C][/ROW]
[ROW][C]Semi Interquartile Difference (Weighted Average at Xnp)[/C][C]0.01175[/C][/ROW]
[ROW][C]Semi Interquartile Difference (Weighted Average at X(n+1)p)[/C][C]0.013875[/C][/ROW]
[ROW][C]Semi Interquartile Difference (Empirical Distribution Function)[/C][C]0.012[/C][/ROW]
[ROW][C]Semi Interquartile Difference (Empirical Distribution Function - Averaging)[/C][C]0.012[/C][/ROW]
[ROW][C]Semi Interquartile Difference (Empirical Distribution Function - Interpolation)[/C][C]0.0115[/C][/ROW]
[ROW][C]Semi Interquartile Difference (Closest Observation)[/C][C]0.012[/C][/ROW]
[ROW][C]Semi Interquartile Difference (True Basic - Statistics Graphics Toolkit)[/C][C]0.017625[/C][/ROW]
[ROW][C]Semi Interquartile Difference (MS Excel (old versions))[/C][C]0.012[/C][/ROW]
[ROW][C]Coefficient of Quartile Variation (Weighted Average at Xnp)[/C][C]0.000301686[/C][/ROW]
[ROW][C]Coefficient of Quartile Variation (Weighted Average at X(n+1)p)[/C][C]0.000356223[/C][/ROW]
[ROW][C]Coefficient of Quartile Variation (Empirical Distribution Function)[/C][C]0.000308095[/C][/ROW]
[ROW][C]Coefficient of Quartile Variation (Empirical Distribution Function - Averaging)[/C][C]0.000308095[/C][/ROW]
[ROW][C]Coefficient of Quartile Variation (Empirical Distribution Function - Interpolation)[/C][C]0.00029526[/C][/ROW]
[ROW][C]Coefficient of Quartile Variation (Closest Observation)[/C][C]0.000308095[/C][/ROW]
[ROW][C]Coefficient of Quartile Variation (True Basic - Statistics Graphics Toolkit)[/C][C]0.000452467[/C][/ROW]
[ROW][C]Coefficient of Quartile Variation (MS Excel (old versions))[/C][C]0.000308095[/C][/ROW]
[ROW][C]Number of all Pairs of Observations[/C][C]231[/C][/ROW]
[ROW][C]Squared Differences between all Pairs of Observations[/C][C]0.00228772[/C][/ROW]
[ROW][C]Mean Absolute Differences between all Pairs of Observations[/C][C]0.0321558[/C][/ROW]
[ROW][C]Gini Mean Difference[/C][C]0.0321558[/C][/ROW]
[ROW][C]Leik Measure of Dispersion[/C][C]0.523838[/C][/ROW]
[ROW][C]Index of Diversity[/C][C]0.954545[/C][/ROW]
[ROW][C]Index of Qualitative Variation[/C][C]1[/C][/ROW]
[ROW][C]Coefficient of Dispersion[/C][C]0.000523849[/C][/ROW]
[ROW][C]Observations[/C][C]22[/C][/ROW]
[/TABLE]
Source: https://freestatistics.org/blog/index.php?pk=318747&T=2

Globally Unique Identifier (entire table): ba.freestatistics.org/blog/index.php?pk=318747&T=2

As an alternative you can also use a QR Code:  

The GUIDs for individual cells are displayed in the table below:

Variability - Ungrouped Data
Absolute range0.173
Relative range (unbiased)5.11516
Relative range (biased)5.23554
Variance (unbiased)0.00114386
Variance (biased)0.00109187
Standard Deviation (unbiased)0.033821
Standard Deviation (biased)0.0330434
Coefficient of Variation (unbiased)0.000868199
Coefficient of Variation (biased)0.000848238
Mean Squared Error (MSE versus 0)1517.52
Mean Squared Error (MSE versus Mean)0.00109187
Mean Absolute Deviation from Mean (MAD Mean)0.020405
Mean Absolute Deviation from Median (MAD Median)0.0197273
Median Absolute Deviation from Mean0.0178636
Median Absolute Deviation from Median0.0145
Mean Squared Deviation from Mean0.00109187
Mean Squared Deviation from Median0.00110318
Interquartile Difference (Weighted Average at Xnp)0.0235
Interquartile Difference (Weighted Average at X(n+1)p)0.02775
Interquartile Difference (Empirical Distribution Function)0.024
Interquartile Difference (Empirical Distribution Function - Averaging)0.024
Interquartile Difference (Empirical Distribution Function - Interpolation)0.023
Interquartile Difference (Closest Observation)0.024
Interquartile Difference (True Basic - Statistics Graphics Toolkit)0.03525
Interquartile Difference (MS Excel (old versions))0.024
Semi Interquartile Difference (Weighted Average at Xnp)0.01175
Semi Interquartile Difference (Weighted Average at X(n+1)p)0.013875
Semi Interquartile Difference (Empirical Distribution Function)0.012
Semi Interquartile Difference (Empirical Distribution Function - Averaging)0.012
Semi Interquartile Difference (Empirical Distribution Function - Interpolation)0.0115
Semi Interquartile Difference (Closest Observation)0.012
Semi Interquartile Difference (True Basic - Statistics Graphics Toolkit)0.017625
Semi Interquartile Difference (MS Excel (old versions))0.012
Coefficient of Quartile Variation (Weighted Average at Xnp)0.000301686
Coefficient of Quartile Variation (Weighted Average at X(n+1)p)0.000356223
Coefficient of Quartile Variation (Empirical Distribution Function)0.000308095
Coefficient of Quartile Variation (Empirical Distribution Function - Averaging)0.000308095
Coefficient of Quartile Variation (Empirical Distribution Function - Interpolation)0.00029526
Coefficient of Quartile Variation (Closest Observation)0.000308095
Coefficient of Quartile Variation (True Basic - Statistics Graphics Toolkit)0.000452467
Coefficient of Quartile Variation (MS Excel (old versions))0.000308095
Number of all Pairs of Observations231
Squared Differences between all Pairs of Observations0.00228772
Mean Absolute Differences between all Pairs of Observations0.0321558
Gini Mean Difference0.0321558
Leik Measure of Dispersion0.523838
Index of Diversity0.954545
Index of Qualitative Variation1
Coefficient of Dispersion0.000523849
Observations22


Percentiles - Ungrouped Data
pWeighted Average at XnpWeighted Average at X(n+1)pEmpirical Distribution FunctionEmpirical Distribution Function - AveragingEmpirical Distribution Function - InterpolationClosest ObservationTrue Basic - Statistics Graphics ToolkitMS Excel (old versions)
0.0538.909338.9099538.92138.92138.921438.90838.9190538.908
0.138.922638.923438.92938.92938.929138.92138.926638.921
0.1538.929338.9294538.9338.9338.9307538.92938.9295538.929
0.238.93238.93338.93538.93538.935438.9338.93238.935
0.2538.93638.936538.93738.93738.9372538.93738.935538.937
0.338.937638.937938.93838.93838.939538.93838.937138.938
0.3538.941538.943238.94338.94338.944438.94338.946838.943
0.438.946238.94838.94738.94738.94938.94738.95138.947
0.4538.951538.95238.95238.95238.95238.95238.95238.952
0.538.95238.95238.95238.95238.95238.95238.95238.952
0.5538.95238.95238.95238.95238.95238.95238.95238.952
0.638.952638.954438.95538.95538.953838.95238.952638.955
0.6538.95538.95538.95538.95538.95538.95538.95538.955
0.738.956238.958338.95838.95838.957138.95538.960738.958
0.7538.959538.9642538.96138.96138.9602538.96138.9707538.961
0.838.968838.97438.97438.97438.971438.97438.97438.974
0.8538.97438.978438.97438.97438.97438.97438.977638.982
0.938.980438.98238.98238.98238.981238.98238.98238.982
0.9538.98239.0661538.98238.98238.98238.98238.9968539.081

\begin{tabular}{lllllllll}
\hline
Percentiles - Ungrouped Data \tabularnewline
p & Weighted Average at Xnp & Weighted Average at X(n+1)p & Empirical Distribution Function & Empirical Distribution Function - Averaging & Empirical Distribution Function - Interpolation & Closest Observation & True Basic - Statistics Graphics Toolkit & MS Excel (old versions) \tabularnewline
0.05 & 38.9093 & 38.90995 & 38.921 & 38.921 & 38.9214 & 38.908 & 38.91905 & 38.908 \tabularnewline
0.1 & 38.9226 & 38.9234 & 38.929 & 38.929 & 38.9291 & 38.921 & 38.9266 & 38.921 \tabularnewline
0.15 & 38.9293 & 38.92945 & 38.93 & 38.93 & 38.93075 & 38.929 & 38.92955 & 38.929 \tabularnewline
0.2 & 38.932 & 38.933 & 38.935 & 38.935 & 38.9354 & 38.93 & 38.932 & 38.935 \tabularnewline
0.25 & 38.936 & 38.9365 & 38.937 & 38.937 & 38.93725 & 38.937 & 38.9355 & 38.937 \tabularnewline
0.3 & 38.9376 & 38.9379 & 38.938 & 38.938 & 38.9395 & 38.938 & 38.9371 & 38.938 \tabularnewline
0.35 & 38.9415 & 38.9432 & 38.943 & 38.943 & 38.9444 & 38.943 & 38.9468 & 38.943 \tabularnewline
0.4 & 38.9462 & 38.948 & 38.947 & 38.947 & 38.949 & 38.947 & 38.951 & 38.947 \tabularnewline
0.45 & 38.9515 & 38.952 & 38.952 & 38.952 & 38.952 & 38.952 & 38.952 & 38.952 \tabularnewline
0.5 & 38.952 & 38.952 & 38.952 & 38.952 & 38.952 & 38.952 & 38.952 & 38.952 \tabularnewline
0.55 & 38.952 & 38.952 & 38.952 & 38.952 & 38.952 & 38.952 & 38.952 & 38.952 \tabularnewline
0.6 & 38.9526 & 38.9544 & 38.955 & 38.955 & 38.9538 & 38.952 & 38.9526 & 38.955 \tabularnewline
0.65 & 38.955 & 38.955 & 38.955 & 38.955 & 38.955 & 38.955 & 38.955 & 38.955 \tabularnewline
0.7 & 38.9562 & 38.9583 & 38.958 & 38.958 & 38.9571 & 38.955 & 38.9607 & 38.958 \tabularnewline
0.75 & 38.9595 & 38.96425 & 38.961 & 38.961 & 38.96025 & 38.961 & 38.97075 & 38.961 \tabularnewline
0.8 & 38.9688 & 38.974 & 38.974 & 38.974 & 38.9714 & 38.974 & 38.974 & 38.974 \tabularnewline
0.85 & 38.974 & 38.9784 & 38.974 & 38.974 & 38.974 & 38.974 & 38.9776 & 38.982 \tabularnewline
0.9 & 38.9804 & 38.982 & 38.982 & 38.982 & 38.9812 & 38.982 & 38.982 & 38.982 \tabularnewline
0.95 & 38.982 & 39.06615 & 38.982 & 38.982 & 38.982 & 38.982 & 38.99685 & 39.081 \tabularnewline
\hline
\end{tabular}
%Source: https://freestatistics.org/blog/index.php?pk=318747&T=3

[TABLE]
[ROW][C]Percentiles - Ungrouped Data[/C][/ROW]
[ROW][C]p[/C][C]Weighted Average at Xnp[/C][C]Weighted Average at X(n+1)p[/C][C]Empirical Distribution Function[/C][C]Empirical Distribution Function - Averaging[/C][C]Empirical Distribution Function - Interpolation[/C][C]Closest Observation[/C][C]True Basic - Statistics Graphics Toolkit[/C][C]MS Excel (old versions)[/C][/ROW]
[ROW][C]0.05[/C][C]38.9093[/C][C]38.90995[/C][C]38.921[/C][C]38.921[/C][C]38.9214[/C][C]38.908[/C][C]38.91905[/C][C]38.908[/C][/ROW]
[ROW][C]0.1[/C][C]38.9226[/C][C]38.9234[/C][C]38.929[/C][C]38.929[/C][C]38.9291[/C][C]38.921[/C][C]38.9266[/C][C]38.921[/C][/ROW]
[ROW][C]0.15[/C][C]38.9293[/C][C]38.92945[/C][C]38.93[/C][C]38.93[/C][C]38.93075[/C][C]38.929[/C][C]38.92955[/C][C]38.929[/C][/ROW]
[ROW][C]0.2[/C][C]38.932[/C][C]38.933[/C][C]38.935[/C][C]38.935[/C][C]38.9354[/C][C]38.93[/C][C]38.932[/C][C]38.935[/C][/ROW]
[ROW][C]0.25[/C][C]38.936[/C][C]38.9365[/C][C]38.937[/C][C]38.937[/C][C]38.93725[/C][C]38.937[/C][C]38.9355[/C][C]38.937[/C][/ROW]
[ROW][C]0.3[/C][C]38.9376[/C][C]38.9379[/C][C]38.938[/C][C]38.938[/C][C]38.9395[/C][C]38.938[/C][C]38.9371[/C][C]38.938[/C][/ROW]
[ROW][C]0.35[/C][C]38.9415[/C][C]38.9432[/C][C]38.943[/C][C]38.943[/C][C]38.9444[/C][C]38.943[/C][C]38.9468[/C][C]38.943[/C][/ROW]
[ROW][C]0.4[/C][C]38.9462[/C][C]38.948[/C][C]38.947[/C][C]38.947[/C][C]38.949[/C][C]38.947[/C][C]38.951[/C][C]38.947[/C][/ROW]
[ROW][C]0.45[/C][C]38.9515[/C][C]38.952[/C][C]38.952[/C][C]38.952[/C][C]38.952[/C][C]38.952[/C][C]38.952[/C][C]38.952[/C][/ROW]
[ROW][C]0.5[/C][C]38.952[/C][C]38.952[/C][C]38.952[/C][C]38.952[/C][C]38.952[/C][C]38.952[/C][C]38.952[/C][C]38.952[/C][/ROW]
[ROW][C]0.55[/C][C]38.952[/C][C]38.952[/C][C]38.952[/C][C]38.952[/C][C]38.952[/C][C]38.952[/C][C]38.952[/C][C]38.952[/C][/ROW]
[ROW][C]0.6[/C][C]38.9526[/C][C]38.9544[/C][C]38.955[/C][C]38.955[/C][C]38.9538[/C][C]38.952[/C][C]38.9526[/C][C]38.955[/C][/ROW]
[ROW][C]0.65[/C][C]38.955[/C][C]38.955[/C][C]38.955[/C][C]38.955[/C][C]38.955[/C][C]38.955[/C][C]38.955[/C][C]38.955[/C][/ROW]
[ROW][C]0.7[/C][C]38.9562[/C][C]38.9583[/C][C]38.958[/C][C]38.958[/C][C]38.9571[/C][C]38.955[/C][C]38.9607[/C][C]38.958[/C][/ROW]
[ROW][C]0.75[/C][C]38.9595[/C][C]38.96425[/C][C]38.961[/C][C]38.961[/C][C]38.96025[/C][C]38.961[/C][C]38.97075[/C][C]38.961[/C][/ROW]
[ROW][C]0.8[/C][C]38.9688[/C][C]38.974[/C][C]38.974[/C][C]38.974[/C][C]38.9714[/C][C]38.974[/C][C]38.974[/C][C]38.974[/C][/ROW]
[ROW][C]0.85[/C][C]38.974[/C][C]38.9784[/C][C]38.974[/C][C]38.974[/C][C]38.974[/C][C]38.974[/C][C]38.9776[/C][C]38.982[/C][/ROW]
[ROW][C]0.9[/C][C]38.9804[/C][C]38.982[/C][C]38.982[/C][C]38.982[/C][C]38.9812[/C][C]38.982[/C][C]38.982[/C][C]38.982[/C][/ROW]
[ROW][C]0.95[/C][C]38.982[/C][C]39.06615[/C][C]38.982[/C][C]38.982[/C][C]38.982[/C][C]38.982[/C][C]38.99685[/C][C]39.081[/C][/ROW]
[/TABLE]
Source: https://freestatistics.org/blog/index.php?pk=318747&T=3

Globally Unique Identifier (entire table): ba.freestatistics.org/blog/index.php?pk=318747&T=3

As an alternative you can also use a QR Code:  

The GUIDs for individual cells are displayed in the table below:

Percentiles - Ungrouped Data
pWeighted Average at XnpWeighted Average at X(n+1)pEmpirical Distribution FunctionEmpirical Distribution Function - AveragingEmpirical Distribution Function - InterpolationClosest ObservationTrue Basic - Statistics Graphics ToolkitMS Excel (old versions)
0.0538.909338.9099538.92138.92138.921438.90838.9190538.908
0.138.922638.923438.92938.92938.929138.92138.926638.921
0.1538.929338.9294538.9338.9338.9307538.92938.9295538.929
0.238.93238.93338.93538.93538.935438.9338.93238.935
0.2538.93638.936538.93738.93738.9372538.93738.935538.937
0.338.937638.937938.93838.93838.939538.93838.937138.938
0.3538.941538.943238.94338.94338.944438.94338.946838.943
0.438.946238.94838.94738.94738.94938.94738.95138.947
0.4538.951538.95238.95238.95238.95238.95238.95238.952
0.538.95238.95238.95238.95238.95238.95238.95238.952
0.5538.95238.95238.95238.95238.95238.95238.95238.952
0.638.952638.954438.95538.95538.953838.95238.952638.955
0.6538.95538.95538.95538.95538.95538.95538.95538.955
0.738.956238.958338.95838.95838.957138.95538.960738.958
0.7538.959538.9642538.96138.96138.9602538.96138.9707538.961
0.838.968838.97438.97438.97438.971438.97438.97438.974
0.8538.97438.978438.97438.97438.97438.97438.977638.982
0.938.980438.98238.98238.98238.981238.98238.98238.982
0.9538.98239.0661538.98238.98238.98238.98238.9968539.081


Frequency Table (Histogram)
BinsMidpointAbs. FrequencyRel. FrequencyCumul. Rel. Freq.Density
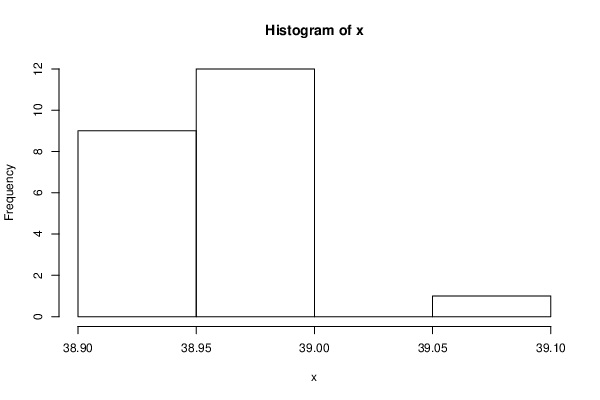
[38.9,38.95[38.92590.4090910.4090918.181818
[38.95,39[38.975120.5454550.95454510.909091
[39,39.05[39.025000.9545450
[39.05,39.1]39.07510.04545510.909091

\begin{tabular}{lllllllll}
\hline
Frequency Table (Histogram) \tabularnewline
Bins & Midpoint & Abs. Frequency & Rel. Frequency & Cumul. Rel. Freq. & Density \tabularnewline
[38.9,38.95[ & 38.925 & 9 & 0.409091 & 0.409091 & 8.181818 \tabularnewline
[38.95,39[ & 38.975 & 12 & 0.545455 & 0.954545 & 10.909091 \tabularnewline
[39,39.05[ & 39.025 & 0 & 0 & 0.954545 & 0 \tabularnewline
[39.05,39.1] & 39.075 & 1 & 0.045455 & 1 & 0.909091 \tabularnewline
\hline
\end{tabular}
%Source: https://freestatistics.org/blog/index.php?pk=318747&T=4

[TABLE]
[ROW][C]Frequency Table (Histogram)[/C][/ROW]
[ROW][C]Bins[/C][C]Midpoint[/C][C]Abs. Frequency[/C][C]Rel. Frequency[/C][C]Cumul. Rel. Freq.[/C][C]Density[/C][/ROW]
[ROW][C][38.9,38.95[[/C][C]38.925[/C][C]9[/C][C]0.409091[/C][C]0.409091[/C][C]8.181818[/C][/ROW]
[ROW][C][38.95,39[[/C][C]38.975[/C][C]12[/C][C]0.545455[/C][C]0.954545[/C][C]10.909091[/C][/ROW]
[ROW][C][39,39.05[[/C][C]39.025[/C][C]0[/C][C]0[/C][C]0.954545[/C][C]0[/C][/ROW]
[ROW][C][39.05,39.1][/C][C]39.075[/C][C]1[/C][C]0.045455[/C][C]1[/C][C]0.909091[/C][/ROW]
[/TABLE]
Source: https://freestatistics.org/blog/index.php?pk=318747&T=4

Globally Unique Identifier (entire table): ba.freestatistics.org/blog/index.php?pk=318747&T=4

As an alternative you can also use a QR Code:  

The GUIDs for individual cells are displayed in the table below:

Frequency Table (Histogram)
BinsMidpointAbs. FrequencyRel. FrequencyCumul. Rel. Freq.Density
[38.9,38.95[38.92590.4090910.4090918.181818
[38.95,39[38.975120.5454550.95454510.909091
[39,39.05[39.025000.9545450
[39.05,39.1]39.07510.04545510.909091


Properties of Density Trace
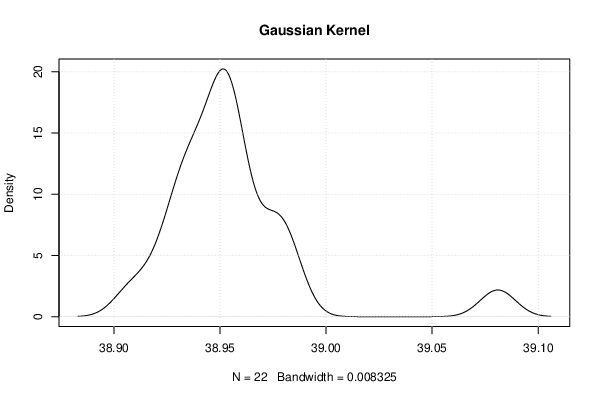
Bandwidth0.00832493806031961
#Observations22

\begin{tabular}{lllllllll}
\hline
Properties of Density Trace \tabularnewline
Bandwidth & 0.00832493806031961 \tabularnewline
#Observations & 22 \tabularnewline
\hline
\end{tabular}
%Source: https://freestatistics.org/blog/index.php?pk=318747&T=5

[TABLE]
[ROW][C]Properties of Density Trace[/C][/ROW]
[ROW][C]Bandwidth[/C][C]0.00832493806031961[/C][/ROW]
[ROW][C]#Observations[/C][C]22[/C][/ROW]
[/TABLE]
Source: https://freestatistics.org/blog/index.php?pk=318747&T=5

Globally Unique Identifier (entire table): ba.freestatistics.org/blog/index.php?pk=318747&T=5

As an alternative you can also use a QR Code:  

The GUIDs for individual cells are displayed in the table below:

Properties of Density Trace
Bandwidth0.00832493806031961
#Observations22


Parameters (Session):
Parameters (R input):
R code (references can be found in the software module):
library(car)
load(file='createtable')
hyperlink <- function(url,anchor,title,target=\'_blank\'){
anchor
}
x <-sort(x[!is.na(x)])
num <- 50
res <- array(NA,dim=c(num,3))
geomean <- function(x) {
return(exp(mean(log(x))))
}
harmean <- function(x) {
return(1/mean(1/x))
}
quamean <- function(x) {
return(sqrt(mean(x*x)))
}
winmean <- function(x) {
x <-sort(x[!is.na(x)])
n<-length(x)
denom <- 3
nodenom <- n/denom
if (nodenom>40) denom <- n/40
sqrtn = sqrt(n)
roundnodenom = floor(nodenom)
win <- array(NA,dim=c(roundnodenom,2))
for (j in 1:roundnodenom) {
win[j,1] <- (j*x[j+1]+sum(x[(j+1):(n-j)])+j*x[n-j])/n
win[j,2] <- sd(c(rep(x[j+1],j),x[(j+1):(n-j)],rep(x[n-j],j)))/sqrtn
}
return(win)
}
trimean <- function(x) {
x <-sort(x[!is.na(x)])
n<-length(x)
denom <- 3
nodenom <- n/denom
if (nodenom>40) denom <- n/40
sqrtn = sqrt(n)
roundnodenom = floor(nodenom)
tri <- array(NA,dim=c(roundnodenom,2))
for (j in 1:roundnodenom) {
tri[j,1] <- mean(x,trim=j/n)
tri[j,2] <- sd(x[(j+1):(n-j)]) / sqrt(n-j*2)
}
return(tri)
}
midrange <- function(x) {
return((max(x)+min(x))/2)
}
q1 <- function(data,n,p,i,f) {
np <- n*p;
i <<- floor(np)
f <<- np - i
qvalue <- (1-f)*data[i] + f*data[i+1]
}
q2 <- function(data,n,p,i,f) {
np <- (n+1)*p
i <<- floor(np)
f <<- np - i
qvalue <- (1-f)*data[i] + f*data[i+1]
}
q3 <- function(data,n,p,i,f) {
np <- n*p
i <<- floor(np)
f <<- np - i
if (f==0) {
qvalue <- data[i]
} else {
qvalue <- data[i+1]
}
}
q4 <- function(data,n,p,i,f) {
np <- n*p
i <<- floor(np)
f <<- np - i
if (f==0) {
qvalue <- (data[i]+data[i+1])/2
} else {
qvalue <- data[i+1]
}
}
q5 <- function(data,n,p,i,f) {
np <- (n-1)*p
i <<- floor(np)
f <<- np - i
if (f==0) {
qvalue <- data[i+1]
} else {
qvalue <- data[i+1] + f*(data[i+2]-data[i+1])
}
}
q6 <- function(data,n,p,i,f) {
np <- n*p+0.5
i <<- floor(np)
f <<- np - i
qvalue <- data[i]
}
q7 <- function(data,n,p,i,f) {
np <- (n+1)*p
i <<- floor(np)
f <<- np - i
if (f==0) {
qvalue <- data[i]
} else {
qvalue <- f*data[i] + (1-f)*data[i+1]
}
}
q8 <- function(data,n,p,i,f) {
np <- (n+1)*p
i <<- floor(np)
f <<- np - i
if (f==0) {
qvalue <- data[i]
} else {
if (f == 0.5) {
qvalue <- (data[i]+data[i+1])/2
} else {
if (f < 0.5) {
qvalue <- data[i]
} else {
qvalue <- data[i+1]
}
}
}
}
iqd <- function(x,def) {
x <-sort(x[!is.na(x)])
n<-length(x)
if (def==1) {
qvalue1 <- q1(x,n,0.25,i,f)
qvalue3 <- q1(x,n,0.75,i,f)
}
if (def==2) {
qvalue1 <- q2(x,n,0.25,i,f)
qvalue3 <- q2(x,n,0.75,i,f)
}
if (def==3) {
qvalue1 <- q3(x,n,0.25,i,f)
qvalue3 <- q3(x,n,0.75,i,f)
}
if (def==4) {
qvalue1 <- q4(x,n,0.25,i,f)
qvalue3 <- q4(x,n,0.75,i,f)
}
if (def==5) {
qvalue1 <- q5(x,n,0.25,i,f)
qvalue3 <- q5(x,n,0.75,i,f)
}
if (def==6) {
qvalue1 <- q6(x,n,0.25,i,f)
qvalue3 <- q6(x,n,0.75,i,f)
}
if (def==7) {
qvalue1 <- q7(x,n,0.25,i,f)
qvalue3 <- q7(x,n,0.75,i,f)
}
if (def==8) {
qvalue1 <- q8(x,n,0.25,i,f)
qvalue3 <- q8(x,n,0.75,i,f)
}
iqdiff <- qvalue3 - qvalue1
return(c(iqdiff,iqdiff/2,iqdiff/(qvalue3 + qvalue1)))
}
midmean <- function(x,def) {
x <-sort(x[!is.na(x)])
n<-length(x)
if (def==1) {
qvalue1 <- q1(x,n,0.25,i,f)
qvalue3 <- q1(x,n,0.75,i,f)
}
if (def==2) {
qvalue1 <- q2(x,n,0.25,i,f)
qvalue3 <- q2(x,n,0.75,i,f)
}
if (def==3) {
qvalue1 <- q3(x,n,0.25,i,f)
qvalue3 <- q3(x,n,0.75,i,f)
}
if (def==4) {
qvalue1 <- q4(x,n,0.25,i,f)
qvalue3 <- q4(x,n,0.75,i,f)
}
if (def==5) {
qvalue1 <- q5(x,n,0.25,i,f)
qvalue3 <- q5(x,n,0.75,i,f)
}
if (def==6) {
qvalue1 <- q6(x,n,0.25,i,f)
qvalue3 <- q6(x,n,0.75,i,f)
}
if (def==7) {
qvalue1 <- q7(x,n,0.25,i,f)
qvalue3 <- q7(x,n,0.75,i,f)
}
if (def==8) {
qvalue1 <- q8(x,n,0.25,i,f)
qvalue3 <- q8(x,n,0.75,i,f)
}
midm <- 0
myn <- 0
roundno4 <- round(n/4)
round3no4 <- round(3*n/4)
for (i in 1:n) {
if ((x[i]>=qvalue1) & (x[i]<=qvalue3)){
midm = midm + x[i]
myn = myn + 1
}
}
midm = midm / myn
return(midm)
}
range <- max(x) - min(x)
lx <- length(x)
biasf <- (lx-1)/lx
varx <- var(x)
bvarx <- varx*biasf
sdx <- sqrt(varx)
mx <- mean(x)
bsdx <- sqrt(bvarx)
x2 <- x*x
mse0 <- sum(x2)/lx
xmm <- x-mx
xmm2 <- xmm*xmm
msem <- sum(xmm2)/lx
axmm <- abs(x - mx)
medx <- median(x)
axmmed <- abs(x - medx)
xmmed <- x - medx
xmmed2 <- xmmed*xmmed
msemed <- sum(xmmed2)/lx
qarr <- array(NA,dim=c(8,3))
for (j in 1:8) {
qarr[j,] <- iqd(x,j)
}
sdpo <- 0
adpo <- 0
for (i in 1:(lx-1)) {
for (j in (i+1):lx) {
ldi <- x[i]-x[j]
aldi <- abs(ldi)
sdpo = sdpo + ldi * ldi
adpo = adpo + aldi
}
}
denom <- (lx*(lx-1)/2)
sdpo = sdpo / denom
adpo = adpo / denom
gmd <- 0
for (i in 1:lx) {
for (j in 1:lx) {
ldi <- abs(x[i]-x[j])
gmd = gmd + ldi
}
}
gmd <- gmd / (lx*(lx-1))
sumx <- sum(x)
pk <- x / sumx
ck <- cumsum(pk)
dk <- array(NA,dim=lx)
for (i in 1:lx) {
if (ck[i] <= 0.5) dk[i] <- ck[i] else dk[i] <- 1 - ck[i]
}
bigd <- sum(dk) * 2 / (lx-1)
iod <- 1 - sum(pk*pk)
res[1,] <- c('Absolute range','absolute.htm', signif(range,6))
res[2,] <- c('Relative range (unbiased)','relative.htm', signif(range/sd(x),6))
res[3,] <- c('Relative range (biased)','relative.htm', signif(range/sqrt(varx*biasf),6))
res[4,] <- c('Variance (unbiased)','unbiased.htm', signif(varx,6))
res[5,] <- c('Variance (biased)','biased.htm', signif(bvarx,6))
res[6,] <- c('Standard Deviation (unbiased)','unbiased1.htm', signif(sdx,6))
res[7,] <- c('Standard Deviation (biased)','biased1.htm', signif(bsdx,6))
res[8,] <- c('Coefficient of Variation (unbiased)','variation.htm', signif(sdx/mx,6))
res[9,] <- c('Coefficient of Variation (biased)','variation.htm', signif(bsdx/mx,6))
res[10,] <- c('Mean Squared Error (MSE versus 0)','mse.htm', signif(mse0,6))
res[11,] <- c('Mean Squared Error (MSE versus Mean)','mse.htm', signif(msem,6))
res[12,] <- c('Mean Absolute Deviation from Mean (MAD Mean)', 'mean2.htm', signif(sum(axmm)/lx,6))
res[13,] <- c('Mean Absolute Deviation from Median (MAD Median)', 'median1.htm', signif(sum(axmmed)/lx,6))
res[14,] <- c('Median Absolute Deviation from Mean', 'mean3.htm', signif(median(axmm),6))
res[15,] <- c('Median Absolute Deviation from Median', 'median2.htm', signif(median(axmmed),6))
res[16,] <- c('Mean Squared Deviation from Mean', 'mean1.htm', signif(msem,6))
res[17,] <- c('Mean Squared Deviation from Median', 'median.htm', signif(msemed,6))
mylink1 <- hyperlink('difference.htm','Interquartile Difference','')
mylink2 <- paste(mylink1,hyperlink('method_1.htm','(Weighted Average at Xnp)',''),sep=' ')
res[18,] <- c('', mylink2, signif(qarr[1,1],6))
mylink2 <- paste(mylink1,hyperlink('method_2.htm','(Weighted Average at X(n+1)p)',''),sep=' ')
res[19,] <- c('', mylink2, signif(qarr[2,1],6))
mylink2 <- paste(mylink1,hyperlink('method_3.htm','(Empirical Distribution Function)',''),sep=' ')
res[20,] <- c('', mylink2, signif(qarr[3,1],6))
mylink2 <- paste(mylink1,hyperlink('method_4.htm','(Empirical Distribution Function - Averaging)',''),sep=' ')
res[21,] <- c('', mylink2, signif(qarr[4,1],6))
mylink2 <- paste(mylink1,hyperlink('method_5.htm','(Empirical Distribution Function - Interpolation)',''),sep=' ')
res[22,] <- c('', mylink2, signif(qarr[5,1],6))
mylink2 <- paste(mylink1,hyperlink('method_6.htm','(Closest Observation)',''),sep=' ')
res[23,] <- c('', mylink2, signif(qarr[6,1],6))
mylink2 <- paste(mylink1,hyperlink('method_7.htm','(True Basic - Statistics Graphics Toolkit)',''),sep=' ')
res[24,] <- c('', mylink2, signif(qarr[7,1],6))
mylink2 <- paste(mylink1,hyperlink('method_8.htm','(MS Excel (old versions))',''),sep=' ')
res[25,] <- c('', mylink2, signif(qarr[8,1],6))
mylink1 <- hyperlink('deviation.htm','Semi Interquartile Difference','')
mylink2 <- paste(mylink1,hyperlink('method_1.htm','(Weighted Average at Xnp)',''),sep=' ')
res[26,] <- c('', mylink2, signif(qarr[1,2],6))
mylink2 <- paste(mylink1,hyperlink('method_2.htm','(Weighted Average at X(n+1)p)',''),sep=' ')
res[27,] <- c('', mylink2, signif(qarr[2,2],6))
mylink2 <- paste(mylink1,hyperlink('method_3.htm','(Empirical Distribution Function)',''),sep=' ')
res[28,] <- c('', mylink2, signif(qarr[3,2],6))
mylink2 <- paste(mylink1,hyperlink('method_4.htm','(Empirical Distribution Function - Averaging)',''),sep=' ')
res[29,] <- c('', mylink2, signif(qarr[4,2],6))
mylink2 <- paste(mylink1,hyperlink('method_5.htm','(Empirical Distribution Function - Interpolation)',''),sep=' ')
res[30,] <- c('', mylink2, signif(qarr[5,2],6))
mylink2 <- paste(mylink1,hyperlink('method_6.htm','(Closest Observation)',''),sep=' ')
res[31,] <- c('', mylink2, signif(qarr[6,2],6))
mylink2 <- paste(mylink1,hyperlink('method_7.htm','(True Basic - Statistics Graphics Toolkit)',''),sep=' ')
res[32,] <- c('', mylink2, signif(qarr[7,2],6))
mylink2 <- paste(mylink1,hyperlink('method_8.htm','(MS Excel (old versions))',''),sep=' ')
res[33,] <- c('', mylink2, signif(qarr[8,2],6))
mylink1 <- hyperlink('variation1.htm','Coefficient of Quartile Variation','')
mylink2 <- paste(mylink1,hyperlink('method_1.htm','(Weighted Average at Xnp)',''),sep=' ')
res[34,] <- c('', mylink2, signif(qarr[1,3],6))
mylink2 <- paste(mylink1,hyperlink('method_2.htm','(Weighted Average at X(n+1)p)',''),sep=' ')
res[35,] <- c('', mylink2, signif(qarr[2,3],6))
mylink2 <- paste(mylink1,hyperlink('method_3.htm','(Empirical Distribution Function)',''),sep=' ')
res[36,] <- c('', mylink2, signif(qarr[3,3],6))
mylink2 <- paste(mylink1,hyperlink('method_4.htm','(Empirical Distribution Function - Averaging)',''),sep=' ')
res[37,] <- c('', mylink2, signif(qarr[4,3],6))
mylink2 <- paste(mylink1,hyperlink('method_5.htm','(Empirical Distribution Function - Interpolation)',''),sep=' ')
res[38,] <- c('', mylink2, signif(qarr[5,3],6))
mylink2 <- paste(mylink1,hyperlink('method_6.htm','(Closest Observation)',''),sep=' ')
res[39,] <- c('', mylink2, signif(qarr[6,3],6))
mylink2 <- paste(mylink1,hyperlink('method_7.htm','(True Basic - Statistics Graphics Toolkit)',''),sep=' ')
res[40,] <- c('', mylink2, signif(qarr[7,3],6))
mylink2 <- paste(mylink1,hyperlink('method_8.htm','(MS Excel (old versions))',''),sep=' ')
res[41,] <- c('', mylink2, signif(qarr[8,3],6))
res[42,] <- c('Number of all Pairs of Observations', 'pair_numbers.htm', signif(lx*(lx-1)/2,6))
res[43,] <- c('Squared Differences between all Pairs of Observations', 'squared_differences.htm', signif(sdpo,6))
res[44,] <- c('Mean Absolute Differences between all Pairs of Observations', 'mean_abs_differences.htm', signif(adpo,6))
res[45,] <- c('Gini Mean Difference', 'gini_mean_difference.htm', signif(gmd,6))
res[46,] <- c('Leik Measure of Dispersion', 'leiks_d.htm', signif(bigd,6))
res[47,] <- c('Index of Diversity', 'diversity.htm', signif(iod,6))
res[48,] <- c('Index of Qualitative Variation', 'qualitative_variation.htm', signif(iod*lx/(lx-1),6))
res[49,] <- c('Coefficient of Dispersion', 'dispersion.htm', signif(sum(axmm)/lx/medx,6))
res[50,] <- c('Observations', '', lx)
print(res)
(arm <- mean(x))
sqrtn <- sqrt(length(x))
(armse <- sd(x) / sqrtn)
(armose <- arm / armse)
(geo <- geomean(x))
(har <- harmean(x))
(qua <- quamean(x))
(win <- winmean(x))
(tri <- trimean(x))
(midr <- midrange(x))
midm <- array(NA,dim=8)
for (j in 1:8) midm[j] <- midmean(x,j)
print(midm)
bitmap(file='test1.png')
lb <- win[,1] - 2*win[,2]
ub <- win[,1] + 2*win[,2]
if ((ylimmin == '') | (ylimmax == '')) plot(win[,1],type='b',main='Robustness of Central Tendency', xlab='j', pch=19, ylab='Winsorized Mean(j/n)', ylim=c(min(lb),max(ub))) else plot(win[,1],type='l',main='Robustness of Central Tendency', xlab='j', pch=19, ylab='Winsorized Mean(j/n)', ylim=c(ylimmin,ylimmax))
lines(ub,lty=3)
lines(lb,lty=3)
grid()
dev.off()
bitmap(file='test2.png')
lb <- tri[,1] - 2*tri[,2]
ub <- tri[,1] + 2*tri[,2]
if ((ylimmin == '') | (ylimmax == '')) plot(tri[,1],type='b',main='Robustness of Central Tendency', xlab='j', pch=19, ylab='Trimmed Mean(j/n)', ylim=c(min(lb),max(ub))) else plot(tri[,1],type='l',main='Robustness of Central Tendency', xlab='j', pch=19, ylab='Trimmed Mean(j/n)', ylim=c(ylimmin,ylimmax))
lines(ub,lty=3)
lines(lb,lty=3)
grid()
dev.off()
a<-table.start()
a<-table.row.start(a)
a<-table.element(a,'Central Tendency - Ungrouped Data',4,TRUE)
a<-table.row.end(a)
a<-table.row.start(a)
a<-table.element(a,'Measure',header=TRUE)
a<-table.element(a,'Value',header=TRUE)
a<-table.element(a,'S.E.',header=TRUE)
a<-table.element(a,'Value/S.E.',header=TRUE)
a<-table.row.end(a)
a<-table.row.start(a)
a<-table.element(a,hyperlink('arithmetic_mean.htm', 'Arithmetic Mean', 'click to view the definition of the Arithmetic Mean'),header=TRUE)
a<-table.element(a,signif(arm,6))
a<-table.element(a,hyperlink('arithmetic_mean_standard_error.htm', signif(armse,6), 'click to view the definition of the Standard Error of the Arithmetic Mean'))
a<-table.element(a,signif(armose,6))
a<-table.row.end(a)
a<-table.row.start(a)
a<-table.element(a,hyperlink('geometric_mean.htm', 'Geometric Mean', 'click to view the definition of the Geometric Mean'),header=TRUE)
a<-table.element(a,signif(geo,6))
a<-table.element(a,'')
a<-table.row.end(a)
a<-table.row.start(a)
a<-table.element(a,hyperlink('harmonic_mean.htm', 'Harmonic Mean', 'click to view the definition of the Harmonic Mean'),header=TRUE)
a<-table.element(a,signif(har,6))
a<-table.element(a,'')
a<-table.row.end(a)
a<-table.row.start(a)
a<-table.element(a,hyperlink('quadratic_mean.htm', 'Quadratic Mean', 'click to view the definition of the Quadratic Mean'),header=TRUE)
a<-table.element(a,signif(qua,6))
a<-table.element(a,'')
a<-table.row.end(a)
for (j in 1:length(win[,1])) {
a<-table.row.start(a)
mylabel <- paste('Winsorized Mean (',j)
mylabel <- paste(mylabel,'/')
mylabel <- paste(mylabel,length(win[,1]))
mylabel <- paste(mylabel,')')
a<-table.element(a,hyperlink('winsorized_mean.htm', mylabel, 'click to view the definition of the Winsorized Mean'),header=TRUE)
a<-table.element(a,signif(win[j,1],6))
a<-table.element(a,signif(win[j,2],6))
a<-table.element(a,signif(win[j,1]/win[j,2],6))
a<-table.row.end(a)
}
for (j in 1:length(tri[,1])) {
a<-table.row.start(a)
mylabel <- paste('Trimmed Mean (',j)
mylabel <- paste(mylabel,'/')
mylabel <- paste(mylabel,length(tri[,1]))
mylabel <- paste(mylabel,')')
a<-table.element(a,hyperlink('arithmetic_mean.htm', mylabel, 'click to view the definition of the Trimmed Mean'),header=TRUE)
a<-table.element(a,signif(tri[j,1],6))
a<-table.element(a,signif(tri[j,2],6))
a<-table.element(a,signif(tri[j,1]/tri[j,2],6))
a<-table.row.end(a)
}
a<-table.row.start(a)
a<-table.element(a,hyperlink('median_1.htm', 'Median', 'click to view the definition of the Median'),header=TRUE)
a<-table.element(a,signif(median(x),6))
a<-table.element(a,'')
a<-table.row.end(a)
a<-table.row.start(a)
a<-table.element(a,hyperlink('midrange.htm', 'Midrange', 'click to view the definition of the Midrange'),header=TRUE)
a<-table.element(a,signif(midr,6))
a<-table.element(a,'')
a<-table.row.end(a)
a<-table.row.start(a)
mymid <- hyperlink('midmean.htm', 'Midmean', 'click to view the definition of the Midmean')
mylabel <- paste(mymid,hyperlink('method_1.htm','Weighted Average at Xnp',''),sep=' - ')
a<-table.element(a,mylabel,header=TRUE)
a<-table.element(a,signif(midm[1],6))
a<-table.element(a,'')
a<-table.row.end(a)
a<-table.row.start(a)
mymid <- hyperlink('midmean.htm', 'Midmean', 'click to view the definition of the Midmean')
mylabel <- paste(mymid,hyperlink('method_2.htm','Weighted Average at X(n+1)p',''),sep=' - ')
a<-table.element(a,mylabel,header=TRUE)
a<-table.element(a,signif(midm[2],6))
a<-table.element(a,'')
a<-table.row.end(a)
a<-table.row.start(a)
mymid <- hyperlink('midmean.htm', 'Midmean', 'click to view the definition of the Midmean')
mylabel <- paste(mymid,hyperlink('method_3.htm','Empirical Distribution Function',''),sep=' - ')
a<-table.element(a,mylabel,header=TRUE)
a<-table.element(a,signif(midm[3],6))
a<-table.element(a,'')
a<-table.row.end(a)
a<-table.row.start(a)
mymid <- hyperlink('midmean.htm', 'Midmean', 'click to view the definition of the Midmean')
mylabel <- paste(mymid,hyperlink('method_4.htm','Empirical Distribution Function - Averaging',''),sep=' - ')
a<-table.element(a,mylabel,header=TRUE)
a<-table.element(a,signif(midm[4],6))
a<-table.element(a,'')
a<-table.row.end(a)
a<-table.row.start(a)
mymid <- hyperlink('midmean.htm', 'Midmean', 'click to view the definition of the Midmean')
mylabel <- paste(mymid,hyperlink('method_5.htm','Empirical Distribution Function - Interpolation',''),sep=' - ')
a<-table.element(a,mylabel,header=TRUE)
a<-table.element(a,signif(midm[5],6))
a<-table.element(a,'')
a<-table.row.end(a)
a<-table.row.start(a)
mymid <- hyperlink('midmean.htm', 'Midmean', 'click to view the definition of the Midmean')
mylabel <- paste(mymid,hyperlink('method_6.htm','Closest Observation',''),sep=' - ')
a<-table.element(a,mylabel,header=TRUE)
a<-table.element(a,signif(midm[6],6))
a<-table.element(a,'')
a<-table.row.end(a)
a<-table.row.start(a)
mymid <- hyperlink('midmean.htm', 'Midmean', 'click to view the definition of the Midmean')
mylabel <- paste(mymid,hyperlink('method_7.htm','True Basic - Statistics Graphics Toolkit',''),sep=' - ')
a<-table.element(a,mylabel,header=TRUE)
a<-table.element(a,signif(midm[7],6))
a<-table.element(a,'')
a<-table.row.end(a)
a<-table.row.start(a)
mymid <- hyperlink('midmean.htm', 'Midmean', 'click to view the definition of the Midmean')
mylabel <- paste(mymid,hyperlink('method_8.htm','MS Excel (old versions)',''),sep=' - ')
a<-table.element(a,mylabel,header=TRUE)
a<-table.element(a,signif(midm[8],6))
a<-table.element(a,'')
a<-table.row.end(a)
a<-table.row.start(a)
a<-table.element(a,'Number of observations',header=TRUE)
a<-table.element(a,length(x))
a<-table.element(a,'')
a<-table.row.end(a)
a<-table.end(a)
table.save(a,file='mytable.tab')
a<-table.start()
a<-table.row.start(a)
a<-table.element(a,'Variability - Ungrouped Data',2,TRUE)
a<-table.row.end(a)
for (i in 1:num) {
a<-table.row.start(a)
if (res[i,1] != '') {
a<-table.element(a,hyperlink(res[i,2],res[i,1],''),header=TRUE)
} else {
a<-table.element(a,res[i,2],header=TRUE)
}
a<-table.element(a,res[i,3])
a<-table.row.end(a)
}
a<-table.end(a)
table.save(a,file='mytable1.tab')
lx <- length(x)
qval <- array(NA,dim=c(99,8))
mystep <- 25
mystart <- 25
if (lx>10){
mystep=10
mystart=10
}
if (lx>20){
mystep=5
mystart=5
}
if (lx>50){
mystep=2
mystart=2
}
if (lx>=100){
mystep=1
mystart=1
}
for (perc in seq(mystart,99,mystep)) {
qval[perc,1] <- q1(x,lx,perc/100,i,f)
qval[perc,2] <- q2(x,lx,perc/100,i,f)
qval[perc,3] <- q3(x,lx,perc/100,i,f)
qval[perc,4] <- q4(x,lx,perc/100,i,f)
qval[perc,5] <- q5(x,lx,perc/100,i,f)
qval[perc,6] <- q6(x,lx,perc/100,i,f)
qval[perc,7] <- q7(x,lx,perc/100,i,f)
qval[perc,8] <- q8(x,lx,perc/100,i,f)
}
bitmap(file='test3.png')
qqPlot(x,dist='norm',main='QQ plot (Normal) with confidence intervals')
grid()
dev.off()
a<-table.start()
a<-table.row.start(a)
a<-table.element(a,'Percentiles - Ungrouped Data',9,TRUE)
a<-table.row.end(a)
a<-table.row.start(a)
a<-table.element(a,'p',1,TRUE)
a<-table.element(a,hyperlink('method_1.htm', 'Weighted Average at Xnp',''),1,TRUE)
a<-table.element(a,hyperlink('method_2.htm','Weighted Average at X(n+1)p',''),1,TRUE)
a<-table.element(a,hyperlink('method_3.htm','Empirical Distribution Function',''),1,TRUE)
a<-table.element(a,hyperlink('method_4.htm','Empirical Distribution Function - Averaging',''),1,TRUE)
a<-table.element(a,hyperlink('method_5.htm','Empirical Distribution Function - Interpolation',''),1,TRUE)
a<-table.element(a,hyperlink('method_6.htm','Closest Observation',''),1,TRUE)
a<-table.element(a,hyperlink('method_7.htm','True Basic - Statistics Graphics Toolkit',''),1,TRUE)
a<-table.element(a,hyperlink('method_8.htm','MS Excel (old versions)',''),1,TRUE)
a<-table.row.end(a)
for (perc in seq(mystart,99,mystep)) {
a<-table.row.start(a)
a<-table.element(a,round(perc/100,2),1,TRUE)
for (j in 1:8) {
a<-table.element(a,round(qval[perc,j],6))
}
a<-table.row.end(a)
}
a<-table.end(a)
table.save(a,file='mytable2.tab')
bitmap(file='histogram1.png')
myhist<-hist(x)
dev.off()
myhist
n <- length(x)
a<-table.start()
a<-table.row.start(a)
a<-table.element(a,hyperlink('histogram.htm','Frequency Table (Histogram)',''),6,TRUE)
a<-table.row.end(a)
a<-table.row.start(a)
a<-table.element(a,'Bins',header=TRUE)
a<-table.element(a,'Midpoint',header=TRUE)
a<-table.element(a,'Abs. Frequency',header=TRUE)
a<-table.element(a,'Rel. Frequency',header=TRUE)
a<-table.element(a,'Cumul. Rel. Freq.',header=TRUE)
a<-table.element(a,'Density',header=TRUE)
a<-table.row.end(a)
crf <- 0
mybracket <- '['
mynumrows <- (length(myhist$breaks)-1)
for (i in 1:mynumrows) {
a<-table.row.start(a)
if (i == 1)
dum <- paste('[',myhist$breaks[i],sep='')
else
dum <- paste(mybracket,myhist$breaks[i],sep='')
dum <- paste(dum,myhist$breaks[i+1],sep=',')
if (i==mynumrows)
dum <- paste(dum,']',sep='')
else
dum <- paste(dum,mybracket,sep='')
a<-table.element(a,dum,header=TRUE)
a<-table.element(a,myhist$mids[i])
a<-table.element(a,myhist$counts[i])
rf <- myhist$counts[i]/n
crf <- crf + rf
a<-table.element(a,round(rf,6))
a<-table.element(a,round(crf,6))
a<-table.element(a,round(myhist$density[i],6))
a<-table.row.end(a)
}
a<-table.end(a)
table.save(a,file='mytable5.tab')
bitmap(file='density1.png')
mydensity1<-density(x,kernel='gaussian',na.rm=TRUE)
plot(mydensity1,main='Gaussian Kernel')
grid()
dev.off()
mydensity1
a<-table.start()
a<-table.row.start(a)
a<-table.element(a,'Properties of Density Trace',2,TRUE)
a<-table.row.end(a)
a<-table.row.start(a)
a<-table.element(a,'Bandwidth',header=TRUE)
a<-table.element(a,mydensity1$bw)
a<-table.row.end(a)
a<-table.row.start(a)
a<-table.element(a,'#Observations',header=TRUE)
a<-table.element(a,mydensity1$n)
a<-table.row.end(a)
a<-table.end(a)
table.save(a,file='mytable4.tab')