Free Statistics

of Irreproducible Research!

Author's title

Author*Unverified author*
R Software Modulerwasp_autocorrelation.wasp
Title produced by software(Partial) Autocorrelation Function
Date of computationSun, 01 Dec 2019 11:41:09 +0100
Cite this page as followsStatistical Computations at FreeStatistics.org, Office for Research Development and Education, URL https://freestatistics.org/blog/index.php?v=date/2019/Dec/01/t1575197001buyzq9rrdtmnetc.htm/, Retrieved Sat, 18 May 2024 06:18:37 +0000
Statistical Computations at FreeStatistics.org, Office for Research Development and Education, URL https://freestatistics.org/blog/index.php?pk=318958, Retrieved Sat, 18 May 2024 06:18:37 +0000
QR Codes:

Original text written by user:
IsPrivate?No (this computation is public)
User-defined keywords
Estimated Impact118
Family? (F = Feedback message, R = changed R code, M = changed R Module, P = changed Parameters, D = changed Data)
-       [(Partial) Autocorrelation Function] [ACF 2] [2019-12-01 10:41:09] [d41d8cd98f00b204e9800998ecf8427e] [Current]
Feedback Forum

Post a new message
Dataseries X:
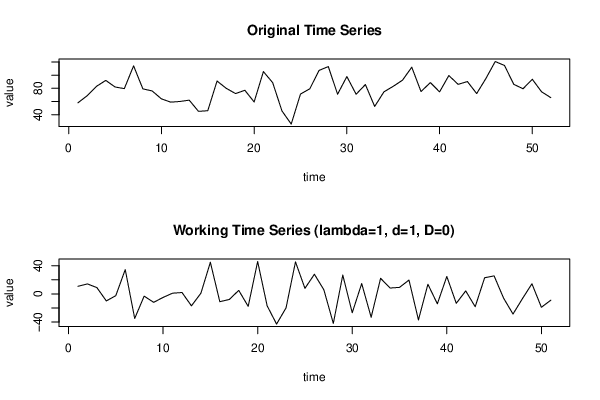
58
68.8
83
92
82
79.5
114.1
79.15
76
64
59
60
62
45
46
91
79.9
72
77
59.3
105.353
88.57365
45.662
25.72145
71.29767
79.2
107.132
112.9816
71
97.8
71
85.7
52.455
74.62875
83
92.3
112
75
88.7
74.6
99.4
86
90.24
72
95
120.62
114.656
86
79.35
93.71
74.702
65.8


Summary of computational transaction
Raw Input view raw input (R code)
Raw Outputview raw output of R engine
Computing time0 seconds
R ServerBig Analytics Cloud Computing Center

\begin{tabular}{lllllllll}
\hline
Summary of computational transaction \tabularnewline
Raw Input view raw input (R code)  \tabularnewline
Raw Outputview raw output of R engine  \tabularnewline
Computing time0 seconds \tabularnewline
R ServerBig Analytics Cloud Computing Center \tabularnewline
\hline
\end{tabular}
%Source: https://freestatistics.org/blog/index.php?pk=318958&T=0

[TABLE]
[ROW]
Summary of computational transaction[/C][/ROW] [ROW]Raw Input[/C] view raw input (R code) [/C][/ROW] [ROW]Raw Output[/C]view raw output of R engine [/C][/ROW] [ROW]Computing time[/C]0 seconds[/C][/ROW] [ROW]R Server[/C]Big Analytics Cloud Computing Center[/C][/ROW] [/TABLE] Source: https://freestatistics.org/blog/index.php?pk=318958&T=0

Globally Unique Identifier (entire table): ba.freestatistics.org/blog/index.php?pk=318958&T=0

As an alternative you can also use a QR Code:  

The GUIDs for individual cells are displayed in the table below:

Summary of computational transaction
Raw Input view raw input (R code)
Raw Outputview raw output of R engine
Computing time0 seconds
R ServerBig Analytics Cloud Computing Center


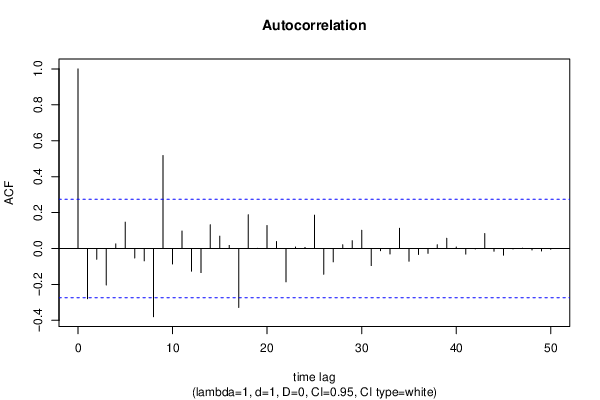
Autocorrelation Function
Time lag kACF(k)T-STATP-value
1-0.280051-20.025422
2-0.059431-0.42440.336522
3-0.203378-1.45240.076256
40.0252960.18060.42868
50.1464821.04610.150225
6-0.052862-0.37750.353681
7-0.068642-0.49020.313046
8-0.379657-2.71130.004555
90.5178673.69830.000266
10-0.085919-0.61360.271108
110.0971790.6940.245417
12-0.126137-0.90080.185965
13-0.134324-0.95930.170976
140.1319140.94210.175304
150.0687540.4910.312767
160.0172420.12310.451242
17-0.328509-2.3460.01145
180.1874591.33870.093298
191.9e-051e-040.499947
200.1278220.91280.182813
210.0384610.27470.392342
22-0.185816-1.3270.095211
230.0076540.05470.478312
240.0061390.04380.482601
250.1853591.32370.095748
26-0.143119-1.02210.155785
27-0.074136-0.52940.299399
280.020820.14870.441193
290.0437790.31260.377912
300.1016070.72560.235695
31-0.095307-0.68060.249592
32-0.01279-0.09130.463791
33-0.030072-0.21480.415408
340.1126060.80420.212516
35-0.071169-0.50830.306734
36-0.032979-0.23550.407374
37-0.026953-0.19250.424064
380.0207120.14790.441498
390.0565260.40370.34407
400.0077760.05550.477967
41-0.031378-0.22410.411793
42-0.002862-0.02040.491888
430.0828620.59180.278316
44-0.015383-0.10990.456477
45-0.037819-0.27010.394095
46-0.002347-0.01680.493347
470.0020040.01430.49432
48-0.008006-0.05720.477315
49-0.013392-0.09560.462092
50-0.003898-0.02780.48895
51NANANA
52NANANA
53NANANA
54NANANA
55NANANA
56NANANA
57NANANA
58NANANA
59NANANA
60NANANA

\begin{tabular}{lllllllll}
\hline
Autocorrelation Function \tabularnewline
Time lag k & ACF(k) & T-STAT & P-value \tabularnewline
1 & -0.280051 & -2 & 0.025422 \tabularnewline
2 & -0.059431 & -0.4244 & 0.336522 \tabularnewline
3 & -0.203378 & -1.4524 & 0.076256 \tabularnewline
4 & 0.025296 & 0.1806 & 0.42868 \tabularnewline
5 & 0.146482 & 1.0461 & 0.150225 \tabularnewline
6 & -0.052862 & -0.3775 & 0.353681 \tabularnewline
7 & -0.068642 & -0.4902 & 0.313046 \tabularnewline
8 & -0.379657 & -2.7113 & 0.004555 \tabularnewline
9 & 0.517867 & 3.6983 & 0.000266 \tabularnewline
10 & -0.085919 & -0.6136 & 0.271108 \tabularnewline
11 & 0.097179 & 0.694 & 0.245417 \tabularnewline
12 & -0.126137 & -0.9008 & 0.185965 \tabularnewline
13 & -0.134324 & -0.9593 & 0.170976 \tabularnewline
14 & 0.131914 & 0.9421 & 0.175304 \tabularnewline
15 & 0.068754 & 0.491 & 0.312767 \tabularnewline
16 & 0.017242 & 0.1231 & 0.451242 \tabularnewline
17 & -0.328509 & -2.346 & 0.01145 \tabularnewline
18 & 0.187459 & 1.3387 & 0.093298 \tabularnewline
19 & 1.9e-05 & 1e-04 & 0.499947 \tabularnewline
20 & 0.127822 & 0.9128 & 0.182813 \tabularnewline
21 & 0.038461 & 0.2747 & 0.392342 \tabularnewline
22 & -0.185816 & -1.327 & 0.095211 \tabularnewline
23 & 0.007654 & 0.0547 & 0.478312 \tabularnewline
24 & 0.006139 & 0.0438 & 0.482601 \tabularnewline
25 & 0.185359 & 1.3237 & 0.095748 \tabularnewline
26 & -0.143119 & -1.0221 & 0.155785 \tabularnewline
27 & -0.074136 & -0.5294 & 0.299399 \tabularnewline
28 & 0.02082 & 0.1487 & 0.441193 \tabularnewline
29 & 0.043779 & 0.3126 & 0.377912 \tabularnewline
30 & 0.101607 & 0.7256 & 0.235695 \tabularnewline
31 & -0.095307 & -0.6806 & 0.249592 \tabularnewline
32 & -0.01279 & -0.0913 & 0.463791 \tabularnewline
33 & -0.030072 & -0.2148 & 0.415408 \tabularnewline
34 & 0.112606 & 0.8042 & 0.212516 \tabularnewline
35 & -0.071169 & -0.5083 & 0.306734 \tabularnewline
36 & -0.032979 & -0.2355 & 0.407374 \tabularnewline
37 & -0.026953 & -0.1925 & 0.424064 \tabularnewline
38 & 0.020712 & 0.1479 & 0.441498 \tabularnewline
39 & 0.056526 & 0.4037 & 0.34407 \tabularnewline
40 & 0.007776 & 0.0555 & 0.477967 \tabularnewline
41 & -0.031378 & -0.2241 & 0.411793 \tabularnewline
42 & -0.002862 & -0.0204 & 0.491888 \tabularnewline
43 & 0.082862 & 0.5918 & 0.278316 \tabularnewline
44 & -0.015383 & -0.1099 & 0.456477 \tabularnewline
45 & -0.037819 & -0.2701 & 0.394095 \tabularnewline
46 & -0.002347 & -0.0168 & 0.493347 \tabularnewline
47 & 0.002004 & 0.0143 & 0.49432 \tabularnewline
48 & -0.008006 & -0.0572 & 0.477315 \tabularnewline
49 & -0.013392 & -0.0956 & 0.462092 \tabularnewline
50 & -0.003898 & -0.0278 & 0.48895 \tabularnewline
51 & NA & NA & NA \tabularnewline
52 & NA & NA & NA \tabularnewline
53 & NA & NA & NA \tabularnewline
54 & NA & NA & NA \tabularnewline
55 & NA & NA & NA \tabularnewline
56 & NA & NA & NA \tabularnewline
57 & NA & NA & NA \tabularnewline
58 & NA & NA & NA \tabularnewline
59 & NA & NA & NA \tabularnewline
60 & NA & NA & NA \tabularnewline
\hline
\end{tabular}
%Source: https://freestatistics.org/blog/index.php?pk=318958&T=1

[TABLE]
[ROW][C]Autocorrelation Function[/C][/ROW]
[ROW][C]Time lag k[/C][C]ACF(k)[/C][C]T-STAT[/C][C]P-value[/C][/ROW]
[ROW][C]1[/C][C]-0.280051[/C][C]-2[/C][C]0.025422[/C][/ROW]
[ROW][C]2[/C][C]-0.059431[/C][C]-0.4244[/C][C]0.336522[/C][/ROW]
[ROW][C]3[/C][C]-0.203378[/C][C]-1.4524[/C][C]0.076256[/C][/ROW]
[ROW][C]4[/C][C]0.025296[/C][C]0.1806[/C][C]0.42868[/C][/ROW]
[ROW][C]5[/C][C]0.146482[/C][C]1.0461[/C][C]0.150225[/C][/ROW]
[ROW][C]6[/C][C]-0.052862[/C][C]-0.3775[/C][C]0.353681[/C][/ROW]
[ROW][C]7[/C][C]-0.068642[/C][C]-0.4902[/C][C]0.313046[/C][/ROW]
[ROW][C]8[/C][C]-0.379657[/C][C]-2.7113[/C][C]0.004555[/C][/ROW]
[ROW][C]9[/C][C]0.517867[/C][C]3.6983[/C][C]0.000266[/C][/ROW]
[ROW][C]10[/C][C]-0.085919[/C][C]-0.6136[/C][C]0.271108[/C][/ROW]
[ROW][C]11[/C][C]0.097179[/C][C]0.694[/C][C]0.245417[/C][/ROW]
[ROW][C]12[/C][C]-0.126137[/C][C]-0.9008[/C][C]0.185965[/C][/ROW]
[ROW][C]13[/C][C]-0.134324[/C][C]-0.9593[/C][C]0.170976[/C][/ROW]
[ROW][C]14[/C][C]0.131914[/C][C]0.9421[/C][C]0.175304[/C][/ROW]
[ROW][C]15[/C][C]0.068754[/C][C]0.491[/C][C]0.312767[/C][/ROW]
[ROW][C]16[/C][C]0.017242[/C][C]0.1231[/C][C]0.451242[/C][/ROW]
[ROW][C]17[/C][C]-0.328509[/C][C]-2.346[/C][C]0.01145[/C][/ROW]
[ROW][C]18[/C][C]0.187459[/C][C]1.3387[/C][C]0.093298[/C][/ROW]
[ROW][C]19[/C][C]1.9e-05[/C][C]1e-04[/C][C]0.499947[/C][/ROW]
[ROW][C]20[/C][C]0.127822[/C][C]0.9128[/C][C]0.182813[/C][/ROW]
[ROW][C]21[/C][C]0.038461[/C][C]0.2747[/C][C]0.392342[/C][/ROW]
[ROW][C]22[/C][C]-0.185816[/C][C]-1.327[/C][C]0.095211[/C][/ROW]
[ROW][C]23[/C][C]0.007654[/C][C]0.0547[/C][C]0.478312[/C][/ROW]
[ROW][C]24[/C][C]0.006139[/C][C]0.0438[/C][C]0.482601[/C][/ROW]
[ROW][C]25[/C][C]0.185359[/C][C]1.3237[/C][C]0.095748[/C][/ROW]
[ROW][C]26[/C][C]-0.143119[/C][C]-1.0221[/C][C]0.155785[/C][/ROW]
[ROW][C]27[/C][C]-0.074136[/C][C]-0.5294[/C][C]0.299399[/C][/ROW]
[ROW][C]28[/C][C]0.02082[/C][C]0.1487[/C][C]0.441193[/C][/ROW]
[ROW][C]29[/C][C]0.043779[/C][C]0.3126[/C][C]0.377912[/C][/ROW]
[ROW][C]30[/C][C]0.101607[/C][C]0.7256[/C][C]0.235695[/C][/ROW]
[ROW][C]31[/C][C]-0.095307[/C][C]-0.6806[/C][C]0.249592[/C][/ROW]
[ROW][C]32[/C][C]-0.01279[/C][C]-0.0913[/C][C]0.463791[/C][/ROW]
[ROW][C]33[/C][C]-0.030072[/C][C]-0.2148[/C][C]0.415408[/C][/ROW]
[ROW][C]34[/C][C]0.112606[/C][C]0.8042[/C][C]0.212516[/C][/ROW]
[ROW][C]35[/C][C]-0.071169[/C][C]-0.5083[/C][C]0.306734[/C][/ROW]
[ROW][C]36[/C][C]-0.032979[/C][C]-0.2355[/C][C]0.407374[/C][/ROW]
[ROW][C]37[/C][C]-0.026953[/C][C]-0.1925[/C][C]0.424064[/C][/ROW]
[ROW][C]38[/C][C]0.020712[/C][C]0.1479[/C][C]0.441498[/C][/ROW]
[ROW][C]39[/C][C]0.056526[/C][C]0.4037[/C][C]0.34407[/C][/ROW]
[ROW][C]40[/C][C]0.007776[/C][C]0.0555[/C][C]0.477967[/C][/ROW]
[ROW][C]41[/C][C]-0.031378[/C][C]-0.2241[/C][C]0.411793[/C][/ROW]
[ROW][C]42[/C][C]-0.002862[/C][C]-0.0204[/C][C]0.491888[/C][/ROW]
[ROW][C]43[/C][C]0.082862[/C][C]0.5918[/C][C]0.278316[/C][/ROW]
[ROW][C]44[/C][C]-0.015383[/C][C]-0.1099[/C][C]0.456477[/C][/ROW]
[ROW][C]45[/C][C]-0.037819[/C][C]-0.2701[/C][C]0.394095[/C][/ROW]
[ROW][C]46[/C][C]-0.002347[/C][C]-0.0168[/C][C]0.493347[/C][/ROW]
[ROW][C]47[/C][C]0.002004[/C][C]0.0143[/C][C]0.49432[/C][/ROW]
[ROW][C]48[/C][C]-0.008006[/C][C]-0.0572[/C][C]0.477315[/C][/ROW]
[ROW][C]49[/C][C]-0.013392[/C][C]-0.0956[/C][C]0.462092[/C][/ROW]
[ROW][C]50[/C][C]-0.003898[/C][C]-0.0278[/C][C]0.48895[/C][/ROW]
[ROW][C]51[/C][C]NA[/C][C]NA[/C][C]NA[/C][/ROW]
[ROW][C]52[/C][C]NA[/C][C]NA[/C][C]NA[/C][/ROW]
[ROW][C]53[/C][C]NA[/C][C]NA[/C][C]NA[/C][/ROW]
[ROW][C]54[/C][C]NA[/C][C]NA[/C][C]NA[/C][/ROW]
[ROW][C]55[/C][C]NA[/C][C]NA[/C][C]NA[/C][/ROW]
[ROW][C]56[/C][C]NA[/C][C]NA[/C][C]NA[/C][/ROW]
[ROW][C]57[/C][C]NA[/C][C]NA[/C][C]NA[/C][/ROW]
[ROW][C]58[/C][C]NA[/C][C]NA[/C][C]NA[/C][/ROW]
[ROW][C]59[/C][C]NA[/C][C]NA[/C][C]NA[/C][/ROW]
[ROW][C]60[/C][C]NA[/C][C]NA[/C][C]NA[/C][/ROW]
[/TABLE]
Source: https://freestatistics.org/blog/index.php?pk=318958&T=1

Globally Unique Identifier (entire table): ba.freestatistics.org/blog/index.php?pk=318958&T=1

As an alternative you can also use a QR Code:  

The GUIDs for individual cells are displayed in the table below:

Autocorrelation Function
Time lag kACF(k)T-STATP-value
1-0.280051-20.025422
2-0.059431-0.42440.336522
3-0.203378-1.45240.076256
40.0252960.18060.42868
50.1464821.04610.150225
6-0.052862-0.37750.353681
7-0.068642-0.49020.313046
8-0.379657-2.71130.004555
90.5178673.69830.000266
10-0.085919-0.61360.271108
110.0971790.6940.245417
12-0.126137-0.90080.185965
13-0.134324-0.95930.170976
140.1319140.94210.175304
150.0687540.4910.312767
160.0172420.12310.451242
17-0.328509-2.3460.01145
180.1874591.33870.093298
191.9e-051e-040.499947
200.1278220.91280.182813
210.0384610.27470.392342
22-0.185816-1.3270.095211
230.0076540.05470.478312
240.0061390.04380.482601
250.1853591.32370.095748
26-0.143119-1.02210.155785
27-0.074136-0.52940.299399
280.020820.14870.441193
290.0437790.31260.377912
300.1016070.72560.235695
31-0.095307-0.68060.249592
32-0.01279-0.09130.463791
33-0.030072-0.21480.415408
340.1126060.80420.212516
35-0.071169-0.50830.306734
36-0.032979-0.23550.407374
37-0.026953-0.19250.424064
380.0207120.14790.441498
390.0565260.40370.34407
400.0077760.05550.477967
41-0.031378-0.22410.411793
42-0.002862-0.02040.491888
430.0828620.59180.278316
44-0.015383-0.10990.456477
45-0.037819-0.27010.394095
46-0.002347-0.01680.493347
470.0020040.01430.49432
48-0.008006-0.05720.477315
49-0.013392-0.09560.462092
50-0.003898-0.02780.48895
51NANANA
52NANANA
53NANANA
54NANANA
55NANANA
56NANANA
57NANANA
58NANANA
59NANANA
60NANANA


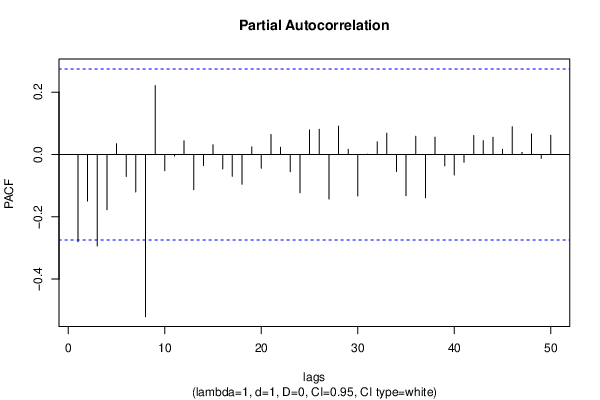
Partial Autocorrelation Function
Time lag kPACF(k)T-STATP-value
1-0.280051-20.025422
2-0.149592-1.06830.145208
3-0.293474-2.09580.02054
4-0.177085-1.26460.105875
50.0347790.24840.402423
6-0.070754-0.50530.307768
7-0.120354-0.85950.197044
8-0.520489-3.7170.000251
90.22111.5790.060263
10-0.052075-0.37190.355757
11-0.004673-0.03340.486755
120.0439840.31410.377359
13-0.113182-0.80830.211342
14-0.035116-0.25080.401496
150.0309440.2210.412993
16-0.046493-0.3320.370614
17-0.069646-0.49740.310532
18-0.095238-0.68010.249748
190.024280.17340.431513
20-0.043986-0.31410.377354
210.0639780.45690.324845
220.0229880.16420.435124
23-0.055124-0.39370.347736
24-0.122798-0.8770.192311
250.0787480.56240.288164
260.0807380.57660.283378
27-0.142872-1.02030.156199
280.0908090.64850.259783
290.0167190.11940.452714
30-0.133083-0.95040.173195
310.000930.00660.497365
320.0407580.29110.386089
330.0683580.48820.31376
34-0.054431-0.38870.349553
35-0.132162-0.94380.174855
360.0584150.41720.339153
37-0.13863-0.990.16342
380.0556460.39740.346369
39-0.036378-0.25980.398036
40-0.066006-0.47140.31969
41-0.024672-0.17620.430419
420.0606280.4330.333431
430.0443530.31670.376366
440.0550560.39320.347912
450.0164580.11750.45345
460.0887370.63370.264552
470.0066470.04750.481161
480.065920.47080.319909
49-0.012507-0.08930.464589
500.0616850.44050.33071
51NANANA
52NANANA
53NANANA
54NANANA
55NANANA
56NANANA
57NANANA
58NANANA
59NANANA
60NANANA

\begin{tabular}{lllllllll}
\hline
Partial Autocorrelation Function \tabularnewline
Time lag k & PACF(k) & T-STAT & P-value \tabularnewline
1 & -0.280051 & -2 & 0.025422 \tabularnewline
2 & -0.149592 & -1.0683 & 0.145208 \tabularnewline
3 & -0.293474 & -2.0958 & 0.02054 \tabularnewline
4 & -0.177085 & -1.2646 & 0.105875 \tabularnewline
5 & 0.034779 & 0.2484 & 0.402423 \tabularnewline
6 & -0.070754 & -0.5053 & 0.307768 \tabularnewline
7 & -0.120354 & -0.8595 & 0.197044 \tabularnewline
8 & -0.520489 & -3.717 & 0.000251 \tabularnewline
9 & 0.2211 & 1.579 & 0.060263 \tabularnewline
10 & -0.052075 & -0.3719 & 0.355757 \tabularnewline
11 & -0.004673 & -0.0334 & 0.486755 \tabularnewline
12 & 0.043984 & 0.3141 & 0.377359 \tabularnewline
13 & -0.113182 & -0.8083 & 0.211342 \tabularnewline
14 & -0.035116 & -0.2508 & 0.401496 \tabularnewline
15 & 0.030944 & 0.221 & 0.412993 \tabularnewline
16 & -0.046493 & -0.332 & 0.370614 \tabularnewline
17 & -0.069646 & -0.4974 & 0.310532 \tabularnewline
18 & -0.095238 & -0.6801 & 0.249748 \tabularnewline
19 & 0.02428 & 0.1734 & 0.431513 \tabularnewline
20 & -0.043986 & -0.3141 & 0.377354 \tabularnewline
21 & 0.063978 & 0.4569 & 0.324845 \tabularnewline
22 & 0.022988 & 0.1642 & 0.435124 \tabularnewline
23 & -0.055124 & -0.3937 & 0.347736 \tabularnewline
24 & -0.122798 & -0.877 & 0.192311 \tabularnewline
25 & 0.078748 & 0.5624 & 0.288164 \tabularnewline
26 & 0.080738 & 0.5766 & 0.283378 \tabularnewline
27 & -0.142872 & -1.0203 & 0.156199 \tabularnewline
28 & 0.090809 & 0.6485 & 0.259783 \tabularnewline
29 & 0.016719 & 0.1194 & 0.452714 \tabularnewline
30 & -0.133083 & -0.9504 & 0.173195 \tabularnewline
31 & 0.00093 & 0.0066 & 0.497365 \tabularnewline
32 & 0.040758 & 0.2911 & 0.386089 \tabularnewline
33 & 0.068358 & 0.4882 & 0.31376 \tabularnewline
34 & -0.054431 & -0.3887 & 0.349553 \tabularnewline
35 & -0.132162 & -0.9438 & 0.174855 \tabularnewline
36 & 0.058415 & 0.4172 & 0.339153 \tabularnewline
37 & -0.13863 & -0.99 & 0.16342 \tabularnewline
38 & 0.055646 & 0.3974 & 0.346369 \tabularnewline
39 & -0.036378 & -0.2598 & 0.398036 \tabularnewline
40 & -0.066006 & -0.4714 & 0.31969 \tabularnewline
41 & -0.024672 & -0.1762 & 0.430419 \tabularnewline
42 & 0.060628 & 0.433 & 0.333431 \tabularnewline
43 & 0.044353 & 0.3167 & 0.376366 \tabularnewline
44 & 0.055056 & 0.3932 & 0.347912 \tabularnewline
45 & 0.016458 & 0.1175 & 0.45345 \tabularnewline
46 & 0.088737 & 0.6337 & 0.264552 \tabularnewline
47 & 0.006647 & 0.0475 & 0.481161 \tabularnewline
48 & 0.06592 & 0.4708 & 0.319909 \tabularnewline
49 & -0.012507 & -0.0893 & 0.464589 \tabularnewline
50 & 0.061685 & 0.4405 & 0.33071 \tabularnewline
51 & NA & NA & NA \tabularnewline
52 & NA & NA & NA \tabularnewline
53 & NA & NA & NA \tabularnewline
54 & NA & NA & NA \tabularnewline
55 & NA & NA & NA \tabularnewline
56 & NA & NA & NA \tabularnewline
57 & NA & NA & NA \tabularnewline
58 & NA & NA & NA \tabularnewline
59 & NA & NA & NA \tabularnewline
60 & NA & NA & NA \tabularnewline
\hline
\end{tabular}
%Source: https://freestatistics.org/blog/index.php?pk=318958&T=2

[TABLE]
[ROW][C]Partial Autocorrelation Function[/C][/ROW]
[ROW][C]Time lag k[/C][C]PACF(k)[/C][C]T-STAT[/C][C]P-value[/C][/ROW]
[ROW][C]1[/C][C]-0.280051[/C][C]-2[/C][C]0.025422[/C][/ROW]
[ROW][C]2[/C][C]-0.149592[/C][C]-1.0683[/C][C]0.145208[/C][/ROW]
[ROW][C]3[/C][C]-0.293474[/C][C]-2.0958[/C][C]0.02054[/C][/ROW]
[ROW][C]4[/C][C]-0.177085[/C][C]-1.2646[/C][C]0.105875[/C][/ROW]
[ROW][C]5[/C][C]0.034779[/C][C]0.2484[/C][C]0.402423[/C][/ROW]
[ROW][C]6[/C][C]-0.070754[/C][C]-0.5053[/C][C]0.307768[/C][/ROW]
[ROW][C]7[/C][C]-0.120354[/C][C]-0.8595[/C][C]0.197044[/C][/ROW]
[ROW][C]8[/C][C]-0.520489[/C][C]-3.717[/C][C]0.000251[/C][/ROW]
[ROW][C]9[/C][C]0.2211[/C][C]1.579[/C][C]0.060263[/C][/ROW]
[ROW][C]10[/C][C]-0.052075[/C][C]-0.3719[/C][C]0.355757[/C][/ROW]
[ROW][C]11[/C][C]-0.004673[/C][C]-0.0334[/C][C]0.486755[/C][/ROW]
[ROW][C]12[/C][C]0.043984[/C][C]0.3141[/C][C]0.377359[/C][/ROW]
[ROW][C]13[/C][C]-0.113182[/C][C]-0.8083[/C][C]0.211342[/C][/ROW]
[ROW][C]14[/C][C]-0.035116[/C][C]-0.2508[/C][C]0.401496[/C][/ROW]
[ROW][C]15[/C][C]0.030944[/C][C]0.221[/C][C]0.412993[/C][/ROW]
[ROW][C]16[/C][C]-0.046493[/C][C]-0.332[/C][C]0.370614[/C][/ROW]
[ROW][C]17[/C][C]-0.069646[/C][C]-0.4974[/C][C]0.310532[/C][/ROW]
[ROW][C]18[/C][C]-0.095238[/C][C]-0.6801[/C][C]0.249748[/C][/ROW]
[ROW][C]19[/C][C]0.02428[/C][C]0.1734[/C][C]0.431513[/C][/ROW]
[ROW][C]20[/C][C]-0.043986[/C][C]-0.3141[/C][C]0.377354[/C][/ROW]
[ROW][C]21[/C][C]0.063978[/C][C]0.4569[/C][C]0.324845[/C][/ROW]
[ROW][C]22[/C][C]0.022988[/C][C]0.1642[/C][C]0.435124[/C][/ROW]
[ROW][C]23[/C][C]-0.055124[/C][C]-0.3937[/C][C]0.347736[/C][/ROW]
[ROW][C]24[/C][C]-0.122798[/C][C]-0.877[/C][C]0.192311[/C][/ROW]
[ROW][C]25[/C][C]0.078748[/C][C]0.5624[/C][C]0.288164[/C][/ROW]
[ROW][C]26[/C][C]0.080738[/C][C]0.5766[/C][C]0.283378[/C][/ROW]
[ROW][C]27[/C][C]-0.142872[/C][C]-1.0203[/C][C]0.156199[/C][/ROW]
[ROW][C]28[/C][C]0.090809[/C][C]0.6485[/C][C]0.259783[/C][/ROW]
[ROW][C]29[/C][C]0.016719[/C][C]0.1194[/C][C]0.452714[/C][/ROW]
[ROW][C]30[/C][C]-0.133083[/C][C]-0.9504[/C][C]0.173195[/C][/ROW]
[ROW][C]31[/C][C]0.00093[/C][C]0.0066[/C][C]0.497365[/C][/ROW]
[ROW][C]32[/C][C]0.040758[/C][C]0.2911[/C][C]0.386089[/C][/ROW]
[ROW][C]33[/C][C]0.068358[/C][C]0.4882[/C][C]0.31376[/C][/ROW]
[ROW][C]34[/C][C]-0.054431[/C][C]-0.3887[/C][C]0.349553[/C][/ROW]
[ROW][C]35[/C][C]-0.132162[/C][C]-0.9438[/C][C]0.174855[/C][/ROW]
[ROW][C]36[/C][C]0.058415[/C][C]0.4172[/C][C]0.339153[/C][/ROW]
[ROW][C]37[/C][C]-0.13863[/C][C]-0.99[/C][C]0.16342[/C][/ROW]
[ROW][C]38[/C][C]0.055646[/C][C]0.3974[/C][C]0.346369[/C][/ROW]
[ROW][C]39[/C][C]-0.036378[/C][C]-0.2598[/C][C]0.398036[/C][/ROW]
[ROW][C]40[/C][C]-0.066006[/C][C]-0.4714[/C][C]0.31969[/C][/ROW]
[ROW][C]41[/C][C]-0.024672[/C][C]-0.1762[/C][C]0.430419[/C][/ROW]
[ROW][C]42[/C][C]0.060628[/C][C]0.433[/C][C]0.333431[/C][/ROW]
[ROW][C]43[/C][C]0.044353[/C][C]0.3167[/C][C]0.376366[/C][/ROW]
[ROW][C]44[/C][C]0.055056[/C][C]0.3932[/C][C]0.347912[/C][/ROW]
[ROW][C]45[/C][C]0.016458[/C][C]0.1175[/C][C]0.45345[/C][/ROW]
[ROW][C]46[/C][C]0.088737[/C][C]0.6337[/C][C]0.264552[/C][/ROW]
[ROW][C]47[/C][C]0.006647[/C][C]0.0475[/C][C]0.481161[/C][/ROW]
[ROW][C]48[/C][C]0.06592[/C][C]0.4708[/C][C]0.319909[/C][/ROW]
[ROW][C]49[/C][C]-0.012507[/C][C]-0.0893[/C][C]0.464589[/C][/ROW]
[ROW][C]50[/C][C]0.061685[/C][C]0.4405[/C][C]0.33071[/C][/ROW]
[ROW][C]51[/C][C]NA[/C][C]NA[/C][C]NA[/C][/ROW]
[ROW][C]52[/C][C]NA[/C][C]NA[/C][C]NA[/C][/ROW]
[ROW][C]53[/C][C]NA[/C][C]NA[/C][C]NA[/C][/ROW]
[ROW][C]54[/C][C]NA[/C][C]NA[/C][C]NA[/C][/ROW]
[ROW][C]55[/C][C]NA[/C][C]NA[/C][C]NA[/C][/ROW]
[ROW][C]56[/C][C]NA[/C][C]NA[/C][C]NA[/C][/ROW]
[ROW][C]57[/C][C]NA[/C][C]NA[/C][C]NA[/C][/ROW]
[ROW][C]58[/C][C]NA[/C][C]NA[/C][C]NA[/C][/ROW]
[ROW][C]59[/C][C]NA[/C][C]NA[/C][C]NA[/C][/ROW]
[ROW][C]60[/C][C]NA[/C][C]NA[/C][C]NA[/C][/ROW]
[/TABLE]
Source: https://freestatistics.org/blog/index.php?pk=318958&T=2

Globally Unique Identifier (entire table): ba.freestatistics.org/blog/index.php?pk=318958&T=2

As an alternative you can also use a QR Code:  

The GUIDs for individual cells are displayed in the table below:

Partial Autocorrelation Function
Time lag kPACF(k)T-STATP-value
1-0.280051-20.025422
2-0.149592-1.06830.145208
3-0.293474-2.09580.02054
4-0.177085-1.26460.105875
50.0347790.24840.402423
6-0.070754-0.50530.307768
7-0.120354-0.85950.197044
8-0.520489-3.7170.000251
90.22111.5790.060263
10-0.052075-0.37190.355757
11-0.004673-0.03340.486755
120.0439840.31410.377359
13-0.113182-0.80830.211342
14-0.035116-0.25080.401496
150.0309440.2210.412993
16-0.046493-0.3320.370614
17-0.069646-0.49740.310532
18-0.095238-0.68010.249748
190.024280.17340.431513
20-0.043986-0.31410.377354
210.0639780.45690.324845
220.0229880.16420.435124
23-0.055124-0.39370.347736
24-0.122798-0.8770.192311
250.0787480.56240.288164
260.0807380.57660.283378
27-0.142872-1.02030.156199
280.0908090.64850.259783
290.0167190.11940.452714
30-0.133083-0.95040.173195
310.000930.00660.497365
320.0407580.29110.386089
330.0683580.48820.31376
34-0.054431-0.38870.349553
35-0.132162-0.94380.174855
360.0584150.41720.339153
37-0.13863-0.990.16342
380.0556460.39740.346369
39-0.036378-0.25980.398036
40-0.066006-0.47140.31969
41-0.024672-0.17620.430419
420.0606280.4330.333431
430.0443530.31670.376366
440.0550560.39320.347912
450.0164580.11750.45345
460.0887370.63370.264552
470.0066470.04750.481161
480.065920.47080.319909
49-0.012507-0.08930.464589
500.0616850.44050.33071
51NANANA
52NANANA
53NANANA
54NANANA
55NANANA
56NANANA
57NANANA
58NANANA
59NANANA
60NANANA


Parameters (Session):
par1 = 60 ; par2 = 1 ; par3 = 1 ; par4 = 0 ; par5 = 12 ; par6 = White Noise ; par7 = 0.95 ;
Parameters (R input):
par1 = 60 ; par2 = 1 ; par3 = 1 ; par4 = 0 ; par5 = 12 ; par6 = White Noise ; par7 = 0.95 ; par8 = ;
R code (references can be found in the software module):
par8 <- ''
par7 <- '0.95'
par6 <- 'White Noise'
par5 <- '12'
par4 <- '0'
par3 <- '0'
par2 <- '1'
par1 <- '60'
if (par1 == 'Default') {
par1 = 10*log10(length(x))
} else {
par1 <- as.numeric(par1)
}
par2 <- as.numeric(par2)
par3 <- as.numeric(par3)
par4 <- as.numeric(par4)
par5 <- as.numeric(par5)
if (par6 == 'White Noise') par6 <- 'white' else par6 <- 'ma'
par7 <- as.numeric(par7)
if (par8 != '') par8 <- as.numeric(par8)
x <- na.omit(x)
ox <- x
if (par8 == '') {
if (par2 == 0) {
x <- log(x)
} else {
x <- (x ^ par2 - 1) / par2
}
} else {
x <- log(x,base=par8)
}
if (par3 > 0) x <- diff(x,lag=1,difference=par3)
if (par4 > 0) x <- diff(x,lag=par5,difference=par4)
bitmap(file='picts.png')
op <- par(mfrow=c(2,1))
plot(ox,type='l',main='Original Time Series',xlab='time',ylab='value')
if (par8=='') {
mytitle <- paste('Working Time Series (lambda=',par2,', d=',par3,', D=',par4,')',sep='')
mysub <- paste('(lambda=',par2,', d=',par3,', D=',par4,', CI=', par7, ', CI type=',par6,')',sep='')
} else {
mytitle <- paste('Working Time Series (base=',par8,', d=',par3,', D=',par4,')',sep='')
mysub <- paste('(base=',par8,', d=',par3,', D=',par4,', CI=', par7, ', CI type=',par6,')',sep='')
}
plot(x,type='l', main=mytitle,xlab='time',ylab='value')
par(op)
dev.off()
bitmap(file='pic1.png')
racf <- acf(x, par1, main='Autocorrelation', xlab='time lag', ylab='ACF', ci.type=par6, ci=par7, sub=mysub)
dev.off()
bitmap(file='pic2.png')
rpacf <- pacf(x,par1,main='Partial Autocorrelation',xlab='lags',ylab='PACF',sub=mysub)
dev.off()
(myacf <- c(racf$acf))
(mypacf <- c(rpacf$acf))
lengthx <- length(x)
sqrtn <- sqrt(lengthx)
load(file='createtable')
a<-table.start()
a<-table.row.start(a)
a<-table.element(a,'Autocorrelation Function',4,TRUE)
a<-table.row.end(a)
a<-table.row.start(a)
a<-table.element(a,'Time lag k',header=TRUE)
a<-table.element(a,'ACF(k)',header=TRUE)
a<-table.element(a,'T-STAT',header=TRUE)
a<-table.element(a,'P-value',header=TRUE)
a<-table.row.end(a)
for (i in 2:(par1+1)) {
a<-table.row.start(a)
a<-table.element(a,i-1,header=TRUE)
a<-table.element(a,round(myacf[i],6))
mytstat <- myacf[i]*sqrtn
a<-table.element(a,round(mytstat,4))
a<-table.element(a,round(1-pt(abs(mytstat),lengthx),6))
a<-table.row.end(a)
}
a<-table.end(a)
table.save(a,file='mytable.tab')
a<-table.start()
a<-table.row.start(a)
a<-table.element(a,'Partial Autocorrelation Function',4,TRUE)
a<-table.row.end(a)
a<-table.row.start(a)
a<-table.element(a,'Time lag k',header=TRUE)
a<-table.element(a,'PACF(k)',header=TRUE)
a<-table.element(a,'T-STAT',header=TRUE)
a<-table.element(a,'P-value',header=TRUE)
a<-table.row.end(a)
for (i in 1:par1) {
a<-table.row.start(a)
a<-table.element(a,i,header=TRUE)
a<-table.element(a,round(mypacf[i],6))
mytstat <- mypacf[i]*sqrtn
a<-table.element(a,round(mytstat,4))
a<-table.element(a,round(1-pt(abs(mytstat),lengthx),6))
a<-table.row.end(a)
}
a<-table.end(a)
table.save(a,file='mytable1.tab')