Free Statistics

of Irreproducible Research!

Author's title

Author*Unverified author*
R Software Modulerwasp_correlation.wasp
Title produced by softwarePearson Correlation
Date of computationMon, 29 Apr 2019 01:17:25 +0200
Cite this page as followsStatistical Computations at FreeStatistics.org, Office for Research Development and Education, URL https://freestatistics.org/blog/index.php?v=date/2019/Apr/29/t1556493598xd8vf9rq8a6oi2f.htm/, Retrieved Sun, 12 May 2024 01:08:48 +0000
Statistical Computations at FreeStatistics.org, Office for Research Development and Education, URL https://freestatistics.org/blog/index.php?pk=318791, Retrieved Sun, 12 May 2024 01:08:48 +0000
QR Codes:

Original text written by user:
IsPrivate?No (this computation is public)
User-defined keywords
Estimated Impact111
Family? (F = Feedback message, R = changed R code, M = changed R Module, P = changed Parameters, D = changed Data)
-       [Pearson Correlation] [] [2019-04-28 23:17:25] [d41d8cd98f00b204e9800998ecf8427e] [Current]
Feedback Forum

Post a new message
Dataseries X:
 2170 
 942 
 2228 
 2570 
 2152 
 2973 
 3039 
 2730 

3169
 442 
 3000 
 3144 
 2670 
 795 
 196 

 3000 
 4460 
 2867 
 4618 
 4797 

 3981 
 4359 
 4800 
 4296 
 4740 
 4691 
 4786 
 5713 
 4749 
 7606 
 5079 
 4854 

 4058 
 3504 
 2120 
 294 
 2190 
 2610 
 5400 
 5400 
 4500 
 423 
 401 


 2006 
 3353 
 3353 
 3100 
 3353 
 3353 
Dataseries Y:
41474
19802
317952
373062
537263
729974
384711
220372

1138,453
229307
195304
238290
661786
44197
49707

162897
265693
74711
166657
58461

137247
76129
71680
49064
54925
53460
81619
91474
112712
28970
357577
179785

336054
415870
465735
136921
482027
89416
7979
8369
8073
1694
18002


398017
406686
40425
71899
59411
3152


Summary of computational transaction
Raw Input view raw input (R code)
Raw Outputview raw output of R engine
Computing time1 seconds
R ServerBig Analytics Cloud Computing Center
R Framework error message
Warning: there are blank lines in the 'Data X' field.
Please, use NA for missing data - blank lines are simply
 deleted and are NOT treated as missing values.

\begin{tabular}{lllllllll}
\hline
Summary of computational transaction \tabularnewline
Raw Input view raw input (R code)  \tabularnewline
Raw Outputview raw output of R engine  \tabularnewline
Computing time1 seconds \tabularnewline
R ServerBig Analytics Cloud Computing Center \tabularnewline
R Framework error message & 
Warning: there are blank lines in the 'Data X' field.
Please, use NA for missing data - blank lines are simply
 deleted and are NOT treated as missing values.
\tabularnewline \hline \end{tabular} %Source: https://freestatistics.org/blog/index.php?pk=318791&T=0

[TABLE]
[ROW]
Summary of computational transaction[/C][/ROW] [ROW]Raw Input[/C] view raw input (R code) [/C][/ROW] [ROW]Raw Output[/C]view raw output of R engine [/C][/ROW] [ROW]Computing time[/C]1 seconds[/C][/ROW] [ROW]R Server[/C]Big Analytics Cloud Computing Center[/C][/ROW] [ROW]R Framework error message[/C][C]
Warning: there are blank lines in the 'Data X' field.
Please, use NA for missing data - blank lines are simply
 deleted and are NOT treated as missing values.
[/C][/ROW] [/TABLE] Source: https://freestatistics.org/blog/index.php?pk=318791&T=0

Globally Unique Identifier (entire table): ba.freestatistics.org/blog/index.php?pk=318791&T=0

As an alternative you can also use a QR Code:  

The GUIDs for individual cells are displayed in the table below:

Summary of computational transaction
Raw Input view raw input (R code)
Raw Outputview raw output of R engine
Computing time1 seconds
R ServerBig Analytics Cloud Computing Center
R Framework error message
Warning: there are blank lines in the 'Data X' field.
Please, use NA for missing data - blank lines are simply
 deleted and are NOT treated as missing values.


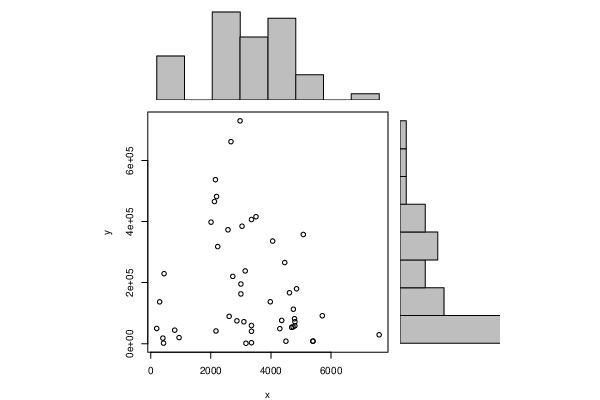
Pearson Product Moment Correlation - Ungrouped Data
StatisticVariable XVariable Y
Mean3286.40816326531184023.070469388
Biased Variance2551895.7109537733638109886.0643
Biased Standard Deviation1597.46540211479183406.951575082
Covariance-47270480.4460497
Correlation-0.158047605437284
Determination0.0249790455844593
T-Test-1.0973113582033
p-value (2 sided)0.278095546536259
p-value (1 sided)0.139047773268129
95% CI of Correlation[-0.42055375317021, 0.128876570336645]
Degrees of Freedom47
Number of Observations49

\begin{tabular}{lllllllll}
\hline
Pearson Product Moment Correlation - Ungrouped Data \tabularnewline
Statistic & Variable X & Variable Y \tabularnewline
Mean & 3286.40816326531 & 184023.070469388 \tabularnewline
Biased Variance & 2551895.71095377 & 33638109886.0643 \tabularnewline
Biased Standard Deviation & 1597.46540211479 & 183406.951575082 \tabularnewline
Covariance & -47270480.4460497 \tabularnewline
Correlation & -0.158047605437284 \tabularnewline
Determination & 0.0249790455844593 \tabularnewline
T-Test & -1.0973113582033 \tabularnewline
p-value (2 sided) & 0.278095546536259 \tabularnewline
p-value (1 sided) & 0.139047773268129 \tabularnewline
95% CI of Correlation & [-0.42055375317021, 0.128876570336645] \tabularnewline
Degrees of Freedom & 47 \tabularnewline
Number of Observations & 49 \tabularnewline
\hline
\end{tabular}
%Source: https://freestatistics.org/blog/index.php?pk=318791&T=1

[TABLE]
[ROW][C]Pearson Product Moment Correlation - Ungrouped Data[/C][/ROW]
[ROW][C]Statistic[/C][C]Variable X[/C][C]Variable Y[/C][/ROW]
[ROW][C]Mean[/C][C]3286.40816326531[/C][C]184023.070469388[/C][/ROW]
[ROW][C]Biased Variance[/C][C]2551895.71095377[/C][C]33638109886.0643[/C][/ROW]
[ROW][C]Biased Standard Deviation[/C][C]1597.46540211479[/C][C]183406.951575082[/C][/ROW]
[ROW][C]Covariance[/C][C]-47270480.4460497[/C][/ROW]
[ROW][C]Correlation[/C][C]-0.158047605437284[/C][/ROW]
[ROW][C]Determination[/C][C]0.0249790455844593[/C][/ROW]
[ROW][C]T-Test[/C][C]-1.0973113582033[/C][/ROW]
[ROW][C]p-value (2 sided)[/C][C]0.278095546536259[/C][/ROW]
[ROW][C]p-value (1 sided)[/C][C]0.139047773268129[/C][/ROW]
[ROW][C]95% CI of Correlation[/C][C][-0.42055375317021, 0.128876570336645][/C][/ROW]
[ROW][C]Degrees of Freedom[/C][C]47[/C][/ROW]
[ROW][C]Number of Observations[/C][C]49[/C][/ROW]
[/TABLE]
Source: https://freestatistics.org/blog/index.php?pk=318791&T=1

Globally Unique Identifier (entire table): ba.freestatistics.org/blog/index.php?pk=318791&T=1

As an alternative you can also use a QR Code:  

The GUIDs for individual cells are displayed in the table below:

Pearson Product Moment Correlation - Ungrouped Data
StatisticVariable XVariable Y
Mean3286.40816326531184023.070469388
Biased Variance2551895.7109537733638109886.0643
Biased Standard Deviation1597.46540211479183406.951575082
Covariance-47270480.4460497
Correlation-0.158047605437284
Determination0.0249790455844593
T-Test-1.0973113582033
p-value (2 sided)0.278095546536259
p-value (1 sided)0.139047773268129
95% CI of Correlation[-0.42055375317021, 0.128876570336645]
Degrees of Freedom47
Number of Observations49


Normality Tests
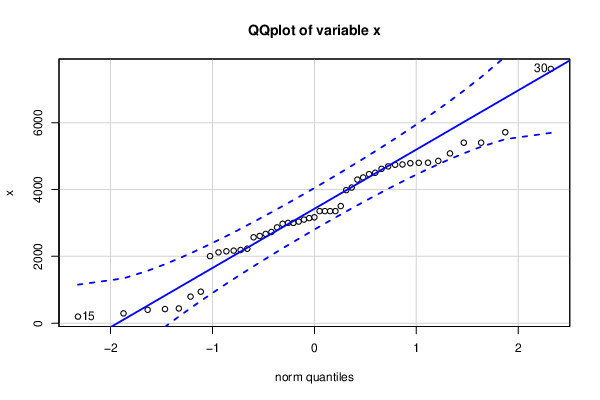
> jarque.x
	Jarque-Bera Normality Test
data:  x
JB = 0.053909, p-value = 0.9734
alternative hypothesis: greater
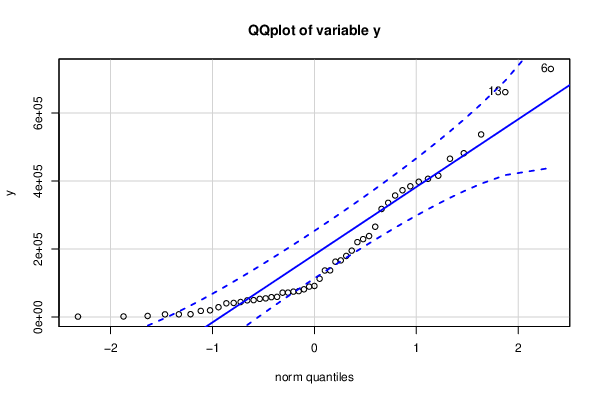
> jarque.y
	Jarque-Bera Normality Test
data:  y
JB = 11.316, p-value = 0.00349
alternative hypothesis: greater
> ad.x
	Anderson-Darling normality test
data:  x
A = 0.60629, p-value = 0.109
> ad.y
	Anderson-Darling normality test
data:  y
A = 2.5508, p-value = 1.545e-06

\begin{tabular}{lllllllll}
\hline
Normality Tests \tabularnewline
> jarque.x
	Jarque-Bera Normality Test
data:  x
JB = 0.053909, p-value = 0.9734
alternative hypothesis: greater
\tabularnewline
> jarque.y
	Jarque-Bera Normality Test
data:  y
JB = 11.316, p-value = 0.00349
alternative hypothesis: greater
\tabularnewline
> ad.x
	Anderson-Darling normality test
data:  x
A = 0.60629, p-value = 0.109
\tabularnewline
> ad.y
	Anderson-Darling normality test
data:  y
A = 2.5508, p-value = 1.545e-06
\tabularnewline \hline \end{tabular} %Source: https://freestatistics.org/blog/index.php?pk=318791&T=2

[TABLE]
[ROW][C]Normality Tests[/C][/ROW]
[ROW][C]
> jarque.x
	Jarque-Bera Normality Test
data:  x
JB = 0.053909, p-value = 0.9734
alternative hypothesis: greater
[/C][/ROW] [ROW][C]
> jarque.y
	Jarque-Bera Normality Test
data:  y
JB = 11.316, p-value = 0.00349
alternative hypothesis: greater
[/C][/ROW] [ROW][C]
> ad.x
	Anderson-Darling normality test
data:  x
A = 0.60629, p-value = 0.109
[/C][/ROW] [ROW][C]
> ad.y
	Anderson-Darling normality test
data:  y
A = 2.5508, p-value = 1.545e-06
[/C][/ROW] [/TABLE] Source: https://freestatistics.org/blog/index.php?pk=318791&T=2

Globally Unique Identifier (entire table): ba.freestatistics.org/blog/index.php?pk=318791&T=2

As an alternative you can also use a QR Code:  

The GUIDs for individual cells are displayed in the table below:

Normality Tests
> jarque.x
	Jarque-Bera Normality Test
data:  x
JB = 0.053909, p-value = 0.9734
alternative hypothesis: greater
> jarque.y
	Jarque-Bera Normality Test
data:  y
JB = 11.316, p-value = 0.00349
alternative hypothesis: greater
> ad.x
	Anderson-Darling normality test
data:  x
A = 0.60629, p-value = 0.109
> ad.y
	Anderson-Darling normality test
data:  y
A = 2.5508, p-value = 1.545e-06


Parameters (Session):
Parameters (R input):
R code (references can be found in the software module):
library(psychometric)
x <- x[!is.na(y)]
y <- y[!is.na(y)]
y <- y[!is.na(x)]
x <- x[!is.na(x)]
bitmap(file='test1.png')
histx <- hist(x, plot=FALSE)
histy <- hist(y, plot=FALSE)
maxcounts <- max(c(histx$counts, histx$counts))
xrange <- c(min(x),max(x))
yrange <- c(min(y),max(y))
nf <- layout(matrix(c(2,0,1,3),2,2,byrow=TRUE), c(3,1), c(1,3), TRUE)
par(mar=c(4,4,1,1))
plot(x, y, xlim=xrange, ylim=yrange, xlab=xlab, ylab=ylab, sub=main)
par(mar=c(0,4,1,1))
barplot(histx$counts, axes=FALSE, ylim=c(0, maxcounts), space=0)
par(mar=c(4,0,1,1))
barplot(histy$counts, axes=FALSE, xlim=c(0, maxcounts), space=0, horiz=TRUE)
dev.off()
lx = length(x)
makebiased = (lx-1)/lx
varx = var(x)*makebiased
vary = var(y)*makebiased
corxy <- cor.test(x,y,method='pearson', na.rm = T)
cxy <- as.matrix(corxy$estimate)[1,1]
load(file='createtable')
a<-table.start()
a<-table.row.start(a)
a<-table.element(a,'Pearson Product Moment Correlation - Ungrouped Data',3,TRUE)
a<-table.row.end(a)
a<-table.row.start(a)
a<-table.element(a,'Statistic',1,TRUE)
a<-table.element(a,'Variable X',1,TRUE)
a<-table.element(a,'Variable Y',1,TRUE)
a<-table.row.end(a)
a<-table.row.start(a)
a<-table.element(a,'Mean',header=TRUE)
a<-table.element(a,mean(x))
a<-table.element(a,mean(y))
a<-table.row.end(a)
a<-table.row.start(a)
a<-table.element(a,'Biased Variance',header=TRUE)
a<-table.element(a,varx)
a<-table.element(a,vary)
a<-table.row.end(a)
a<-table.row.start(a)
a<-table.element(a,'Biased Standard Deviation',header=TRUE)
a<-table.element(a,sqrt(varx))
a<-table.element(a,sqrt(vary))
a<-table.row.end(a)
a<-table.row.start(a)
a<-table.element(a,'Covariance',header=TRUE)
a<-table.element(a,cov(x,y),2)
a<-table.row.end(a)
a<-table.row.start(a)
a<-table.element(a,'Correlation',header=TRUE)
a<-table.element(a,cxy,2)
a<-table.row.end(a)
a<-table.row.start(a)
a<-table.element(a,'Determination',header=TRUE)
a<-table.element(a,cxy*cxy,2)
a<-table.row.end(a)
a<-table.row.start(a)
a<-table.element(a,'T-Test',header=TRUE)
a<-table.element(a,as.matrix(corxy$statistic)[1,1],2)
a<-table.row.end(a)
a<-table.row.start(a)
a<-table.element(a,'p-value (2 sided)',header=TRUE)
a<-table.element(a,(p2 <- as.matrix(corxy$p.value)[1,1]),2)
a<-table.row.end(a)
a<-table.row.start(a)
a<-table.element(a,'p-value (1 sided)',header=TRUE)
a<-table.element(a,p2/2,2)
a<-table.row.end(a)
a<-table.row.start(a)
a<-table.element(a,'95% CI of Correlation',header=TRUE)
a<-table.element(a,paste('[',CIr(r=cxy, n = lx, level = .95)[1],', ', CIr(r=cxy, n = lx, level = .95)[2],']',sep=''),2)
a<-table.row.end(a)
a<-table.row.start(a)
a<-table.element(a,'Degrees of Freedom',header=TRUE)
a<-table.element(a,lx-2,2)
a<-table.row.end(a)
a<-table.row.start(a)
a<-table.element(a,'Number of Observations',header=TRUE)
a<-table.element(a,lx,2)
a<-table.row.end(a)
a<-table.end(a)
table.save(a,file='mytable.tab')
library(moments)
library(nortest)
jarque.x <- jarque.test(x)
jarque.y <- jarque.test(y)
if(lx>7) {
ad.x <- ad.test(x)
ad.y <- ad.test(y)
}
a<-table.start()
a<-table.row.start(a)
a<-table.element(a,'Normality Tests',1,TRUE)
a<-table.row.end(a)
a<-table.row.start(a)
a<-table.element(a,paste('
',RC.texteval('jarque.x'),'
',sep=''))
a<-table.row.end(a)
a<-table.row.start(a)
a<-table.element(a,paste('
',RC.texteval('jarque.y'),'
',sep=''))
a<-table.row.end(a)
if(lx>7) {
a<-table.row.start(a)
a<-table.element(a,paste('
',RC.texteval('ad.x'),'
',sep=''))
a<-table.row.end(a)
a<-table.row.start(a)
a<-table.element(a,paste('
',RC.texteval('ad.y'),'
',sep=''))
a<-table.row.end(a)
}
a<-table.end(a)
table.save(a,file='mytable1.tab')
library(car)
bitmap(file='test2.png')
qqPlot(x,main='QQplot of variable x')
dev.off()
bitmap(file='test3.png')
qqPlot(y,main='QQplot of variable y')
dev.off()