| Pearson Product Moment Correlation - Ungrouped Data | ||
| Statistic | Variable X | Variable Y |
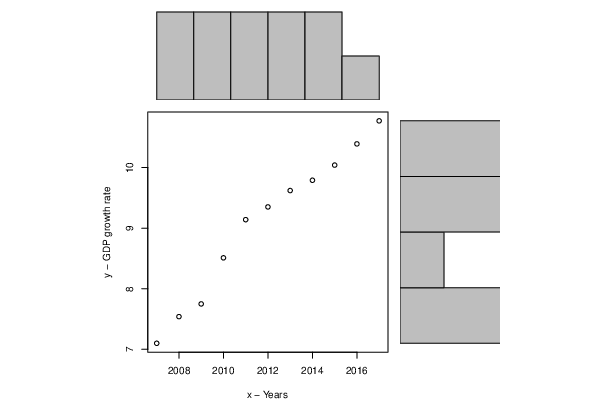
| Mean | 2012 | 9.09090909090909 |
| Biased Variance | 10 | 1.34095371900826 |
| Biased Standard Deviation | 3.16227766016838 | 1.15799556087589 |
| Covariance | 3.966 | |
| Correlation | 0.98458480749439 | |
| Determination | 0.969407243148764 | |
| T-Test | 16.8874889319433 | |
| p-value (2 sided) | 4.01394512701159e-08 | |
| p-value (1 sided) | 2.00697256350579e-08 | |
| 95% CI of Correlation | [0.939755599397927, 0.996122283543825] | |
| Degrees of Freedom | 9 | |
| Number of Observations | 11 | |
| Normality Tests |
> jarque.x Jarque-Bera Normality Test data: x JB = 0.68218, p-value = 0.711 alternative hypothesis: greater |
> jarque.y Jarque-Bera Normality Test data: y JB = 0.81828, p-value = 0.6642 alternative hypothesis: greater |
> ad.x Anderson-Darling normality test data: x A = 0.14662, p-value = 0.9502 |
> ad.y Anderson-Darling normality test data: y A = 0.27763, p-value = 0.5777 |