| ARIMA Parameter Estimation and Backward Selection | |||||||
| Iteration | ar1 | ar2 | ar3 | ma1 | sar1 | sar2 | sma1 |
| Estimates ( 1 ) | 0.4286 | 0.1254 | -0.0328 | -0.8521 | 0.0604 | -0.1271 | -0.7979 |
| (p-val) | (0.0026 ) | (0.1891 ) | (0.7135 ) | (0 ) | (0.5334 ) | (0.1615 ) | (0 ) |
| Estimates ( 2 ) | 0.45 | 0.1283 | 0 | -0.8774 | 0.063 | -0.1283 | -0.7943 |
| (p-val) | (2e-04 ) | (0.1657 ) | (NA ) | (0 ) | (0.5213 ) | (0.1582 ) | (0 ) |
| Estimates ( 3 ) | 0.4332 | 0.1295 | 0 | -0.8662 | 0 | -0.1471 | -0.7574 |
| (p-val) | (2e-04 ) | (0.1603 ) | (NA ) | (0 ) | (NA ) | (0.0854 ) | (0 ) |
| Estimates ( 4 ) | 0.3643 | 0 | 0 | -0.7678 | 0 | -0.1351 | -0.7649 |
| (p-val) | (0.0126 ) | (NA ) | (NA ) | (0 ) | (NA ) | (0.1108 ) | (0 ) |
| Estimates ( 5 ) | 0.3574 | 0 | 0 | -0.7681 | 0 | 0 | -0.8044 |
| (p-val) | (0.0089 ) | (NA ) | (NA ) | (0 ) | (NA ) | (NA ) | (0 ) |
| Estimates ( 6 ) | NA | NA | NA | NA | NA | NA | NA |
| (p-val) | (NA ) | (NA ) | (NA ) | (NA ) | (NA ) | (NA ) | (NA ) |
| Estimates ( 7 ) | NA | NA | NA | NA | NA | NA | NA |
| (p-val) | (NA ) | (NA ) | (NA ) | (NA ) | (NA ) | (NA ) | (NA ) |
| Estimates ( 8 ) | NA | NA | NA | NA | NA | NA | NA |
| (p-val) | (NA ) | (NA ) | (NA ) | (NA ) | (NA ) | (NA ) | (NA ) |
| Estimates ( 9 ) | NA | NA | NA | NA | NA | NA | NA |
| (p-val) | (NA ) | (NA ) | (NA ) | (NA ) | (NA ) | (NA ) | (NA ) |
| Estimates ( 10 ) | NA | NA | NA | NA | NA | NA | NA |
| (p-val) | (NA ) | (NA ) | (NA ) | (NA ) | (NA ) | (NA ) | (NA ) |
| Estimates ( 11 ) | NA | NA | NA | NA | NA | NA | NA |
| (p-val) | (NA ) | (NA ) | (NA ) | (NA ) | (NA ) | (NA ) | (NA ) |
| Estimates ( 12 ) | NA | NA | NA | NA | NA | NA | NA |
| (p-val) | (NA ) | (NA ) | (NA ) | (NA ) | (NA ) | (NA ) | (NA ) |
| Estimates ( 13 ) | NA | NA | NA | NA | NA | NA | NA |
| (p-val) | (NA ) | (NA ) | (NA ) | (NA ) | (NA ) | (NA ) | (NA ) |
| Menu of Residual Diagnostics | |
| Description | Link |
| Histogram | Compute |
| Central Tendency | Compute |
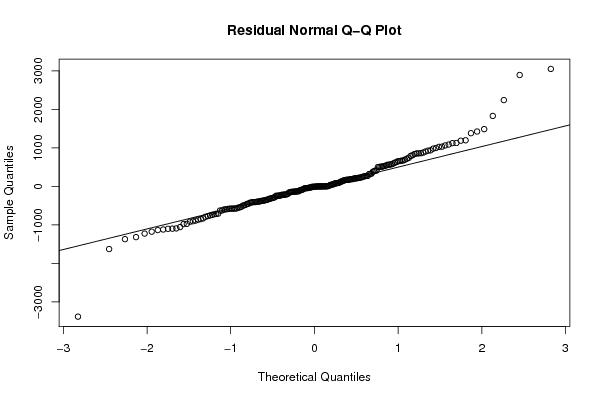
| QQ Plot | Compute |
| Kernel Density Plot | Compute |
| Skewness/Kurtosis Test | Compute |
| Skewness-Kurtosis Plot | Compute |
| Harrell-Davis Plot | Compute |
| Bootstrap Plot -- Central Tendency | Compute |
| Blocked Bootstrap Plot -- Central Tendency | Compute |
| (Partial) Autocorrelation Plot | Compute |
| Spectral Analysis | Compute |
| Tukey lambda PPCC Plot | Compute |
| Box-Cox Normality Plot | Compute |
| Summary Statistics | Compute |