Free Statistics
of Irreproducible Research!
Description of Statistical Computation | ||||||||||||||||||||||||||||||||||||||||||||||||||||||||||||||||||||||||||||||||||||||||||
|---|---|---|---|---|---|---|---|---|---|---|---|---|---|---|---|---|---|---|---|---|---|---|---|---|---|---|---|---|---|---|---|---|---|---|---|---|---|---|---|---|---|---|---|---|---|---|---|---|---|---|---|---|---|---|---|---|---|---|---|---|---|---|---|---|---|---|---|---|---|---|---|---|---|---|---|---|---|---|---|---|---|---|---|---|---|---|---|---|---|---|
| Author's title | ||||||||||||||||||||||||||||||||||||||||||||||||||||||||||||||||||||||||||||||||||||||||||
| Author | *The author of this computation has been verified* | |||||||||||||||||||||||||||||||||||||||||||||||||||||||||||||||||||||||||||||||||||||||||
| R Software Module | rwasp_notchedbox1.wasp | |||||||||||||||||||||||||||||||||||||||||||||||||||||||||||||||||||||||||||||||||||||||||
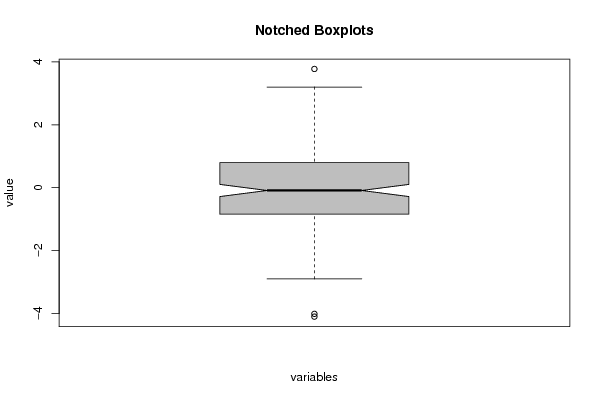
| Title produced by software | Notched Boxplots | |||||||||||||||||||||||||||||||||||||||||||||||||||||||||||||||||||||||||||||||||||||||||
| Date of computation | Thu, 06 Sep 2018 14:28:10 +0200 | |||||||||||||||||||||||||||||||||||||||||||||||||||||||||||||||||||||||||||||||||||||||||
| Cite this page as follows | Statistical Computations at FreeStatistics.org, Office for Research Development and Education, URL https://freestatistics.org/blog/index.php?v=date/2018/Sep/06/t1536236945rai4lzc0ra21m97.htm/, Retrieved Wed, 01 May 2024 23:58:34 +0000 | |||||||||||||||||||||||||||||||||||||||||||||||||||||||||||||||||||||||||||||||||||||||||
| Statistical Computations at FreeStatistics.org, Office for Research Development and Education, URL https://freestatistics.org/blog/index.php?pk=315466, Retrieved Wed, 01 May 2024 23:58:34 +0000 | ||||||||||||||||||||||||||||||||||||||||||||||||||||||||||||||||||||||||||||||||||||||||||
| QR Codes: | ||||||||||||||||||||||||||||||||||||||||||||||||||||||||||||||||||||||||||||||||||||||||||
|
| ||||||||||||||||||||||||||||||||||||||||||||||||||||||||||||||||||||||||||||||||||||||||||
| Original text written by user: | ||||||||||||||||||||||||||||||||||||||||||||||||||||||||||||||||||||||||||||||||||||||||||
| IsPrivate? | No (this computation is public) | |||||||||||||||||||||||||||||||||||||||||||||||||||||||||||||||||||||||||||||||||||||||||
| User-defined keywords | ||||||||||||||||||||||||||||||||||||||||||||||||||||||||||||||||||||||||||||||||||||||||||
| Estimated Impact | 54 | |||||||||||||||||||||||||||||||||||||||||||||||||||||||||||||||||||||||||||||||||||||||||
Tree of Dependent Computations | ||||||||||||||||||||||||||||||||||||||||||||||||||||||||||||||||||||||||||||||||||||||||||
| Family? (F = Feedback message, R = changed R code, M = changed R Module, P = changed Parameters, D = changed Data) | ||||||||||||||||||||||||||||||||||||||||||||||||||||||||||||||||||||||||||||||||||||||||||
| - [Notched Boxplots] [residu boxplot] [2018-09-06 12:28:10] [33956d13de8d8b5d5d1b78ead3554acb] [Current] | ||||||||||||||||||||||||||||||||||||||||||||||||||||||||||||||||||||||||||||||||||||||||||
| Feedback Forum | ||||||||||||||||||||||||||||||||||||||||||||||||||||||||||||||||||||||||||||||||||||||||||
Post a new message | ||||||||||||||||||||||||||||||||||||||||||||||||||||||||||||||||||||||||||||||||||||||||||
Dataset | ||||||||||||||||||||||||||||||||||||||||||||||||||||||||||||||||||||||||||||||||||||||||||
| Dataseries X: | ||||||||||||||||||||||||||||||||||||||||||||||||||||||||||||||||||||||||||||||||||||||||||
1.729 0.1224 0.5238 -0.5018 -1.864 0.07174 -0.3806 -0.2985 1.943 -1.248 1.353 2.844 1.123 -2.325 -2.899 0.2469 -0.7311 1.978 -0.08931 -1.649 1.79 -0.655 -0.9552 -0.5014 -1.475 2.426 -0.3887 -1.42 -0.4357 0.5883 -1.731 0.4162 -0.1356 1.561 -0.6195 0.1301 -0.4857 1.19 0.5049 -0.2667 1.899 0.9836 0.221 -0.1769 -0.1622 0.7891 1.412 0.5182 2.365 -1.244 1.091 0.4222 -0.998 0.7547 -1.444 0.5686 1.354 -1.343 -0.09686 0.2428 0.2557 -0.2432 0.4616 0.06508 2.26 1.805 2.325 0.6828 -0.3356 -0.9979 0.9751 -1.173 -0.0003373 -1.715 -1.349 -1.652 -1.483 0.925 -0.2265 0.7749 -0.3398 0.8931 -0.8646 -1.952 -0.1132 1.025 -1.257 -0.6021 -0.8323 -0.4466 -4.011 0.2885 -1.008 -0.5728 -0.2974 1.216 -0.7275 -0.8439 -1.209 -0.6497 3.2 0.5727 -0.01996 0.4623 -1.287 -1.808 -2.154 0.7078 1.364 0.3147 -4.1 1.27 1.801 -0.4297 0.53 1.188 -0.3982 -0.4219 -2.69 1.014 -0.5421 -0.3687 1.314 -0.4287 -0.6636 1.372 -1.273 0.8102 1.574 -1.025 -0.9989 -0.05362 1.663 -0.178 -1.092 1.968 0.6342 1.388 0.7557 -2.321 1.62 0.4232 -1.705 0.542 -0.593 0.2136 -0.6968 0.07773 -0.7253 2.132 -0.3365 -0.9792 -0.2422 -1.83 -1.148 0.4961 -0.378 0.5646 0.269 0.7527 -2.302 2.826 -0.6076 3.774 1.084 -2.251 0.2907 -1.135 1.416 0.59 1.221 0.0971 -0.906 -0.5977 0.4372 0.7425 1.229 -0.9526 -0.7553 | ||||||||||||||||||||||||||||||||||||||||||||||||||||||||||||||||||||||||||||||||||||||||||
Tables (Output of Computation) | ||||||||||||||||||||||||||||||||||||||||||||||||||||||||||||||||||||||||||||||||||||||||||
| ||||||||||||||||||||||||||||||||||||||||||||||||||||||||||||||||||||||||||||||||||||||||||
Figures (Output of Computation) | ||||||||||||||||||||||||||||||||||||||||||||||||||||||||||||||||||||||||||||||||||||||||||
Input Parameters & R Code | ||||||||||||||||||||||||||||||||||||||||||||||||||||||||||||||||||||||||||||||||||||||||||
| Parameters (Session): | ||||||||||||||||||||||||||||||||||||||||||||||||||||||||||||||||||||||||||||||||||||||||||
| par1 = 12 ; par2 = Single ; par3 = additive ; par4 = 12 ; | ||||||||||||||||||||||||||||||||||||||||||||||||||||||||||||||||||||||||||||||||||||||||||
| Parameters (R input): | ||||||||||||||||||||||||||||||||||||||||||||||||||||||||||||||||||||||||||||||||||||||||||
| par1 = grey ; par2 = no ; | ||||||||||||||||||||||||||||||||||||||||||||||||||||||||||||||||||||||||||||||||||||||||||
| R code (references can be found in the software module): | ||||||||||||||||||||||||||||||||||||||||||||||||||||||||||||||||||||||||||||||||||||||||||
if(par2=='yes') { | ||||||||||||||||||||||||||||||||||||||||||||||||||||||||||||||||||||||||||||||||||||||||||