Free Statistics
of Irreproducible Research!
Description of Statistical Computation | ||||||||||||||||||||||||||||||||||||||||||||||||||||||||||||||||||||||||||||||||||||||||||
|---|---|---|---|---|---|---|---|---|---|---|---|---|---|---|---|---|---|---|---|---|---|---|---|---|---|---|---|---|---|---|---|---|---|---|---|---|---|---|---|---|---|---|---|---|---|---|---|---|---|---|---|---|---|---|---|---|---|---|---|---|---|---|---|---|---|---|---|---|---|---|---|---|---|---|---|---|---|---|---|---|---|---|---|---|---|---|---|---|---|---|
| Author's title | ||||||||||||||||||||||||||||||||||||||||||||||||||||||||||||||||||||||||||||||||||||||||||
| Author | *The author of this computation has been verified* | |||||||||||||||||||||||||||||||||||||||||||||||||||||||||||||||||||||||||||||||||||||||||
| R Software Module | rwasp_notchedbox1.wasp | |||||||||||||||||||||||||||||||||||||||||||||||||||||||||||||||||||||||||||||||||||||||||
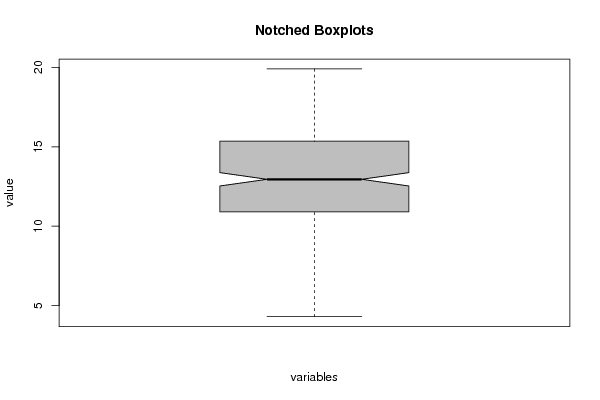
| Title produced by software | Notched Boxplots | |||||||||||||||||||||||||||||||||||||||||||||||||||||||||||||||||||||||||||||||||||||||||
| Date of computation | Thu, 06 Sep 2018 10:18:10 +0200 | |||||||||||||||||||||||||||||||||||||||||||||||||||||||||||||||||||||||||||||||||||||||||
| Cite this page as follows | Statistical Computations at FreeStatistics.org, Office for Research Development and Education, URL https://freestatistics.org/blog/index.php?v=date/2018/Sep/06/t15362243116gt6hivmw93circ.htm/, Retrieved Thu, 02 May 2024 08:02:10 +0000 | |||||||||||||||||||||||||||||||||||||||||||||||||||||||||||||||||||||||||||||||||||||||||
| Statistical Computations at FreeStatistics.org, Office for Research Development and Education, URL https://freestatistics.org/blog/index.php?pk=315306, Retrieved Thu, 02 May 2024 08:02:10 +0000 | ||||||||||||||||||||||||||||||||||||||||||||||||||||||||||||||||||||||||||||||||||||||||||
| QR Codes: | ||||||||||||||||||||||||||||||||||||||||||||||||||||||||||||||||||||||||||||||||||||||||||
|
| ||||||||||||||||||||||||||||||||||||||||||||||||||||||||||||||||||||||||||||||||||||||||||
| Original text written by user: | ||||||||||||||||||||||||||||||||||||||||||||||||||||||||||||||||||||||||||||||||||||||||||
| IsPrivate? | No (this computation is public) | |||||||||||||||||||||||||||||||||||||||||||||||||||||||||||||||||||||||||||||||||||||||||
| User-defined keywords | ||||||||||||||||||||||||||||||||||||||||||||||||||||||||||||||||||||||||||||||||||||||||||
| Estimated Impact | 113 | |||||||||||||||||||||||||||||||||||||||||||||||||||||||||||||||||||||||||||||||||||||||||
Tree of Dependent Computations | ||||||||||||||||||||||||||||||||||||||||||||||||||||||||||||||||||||||||||||||||||||||||||
| Family? (F = Feedback message, R = changed R code, M = changed R Module, P = changed Parameters, D = changed Data) | ||||||||||||||||||||||||||||||||||||||||||||||||||||||||||||||||||||||||||||||||||||||||||
| - [Notched Boxplots] [examenvraag] [2018-09-06 08:18:10] [0f18ed1f73607915ebb279e06a72a0fb] [Current] | ||||||||||||||||||||||||||||||||||||||||||||||||||||||||||||||||||||||||||||||||||||||||||
| Feedback Forum | ||||||||||||||||||||||||||||||||||||||||||||||||||||||||||||||||||||||||||||||||||||||||||
Post a new message | ||||||||||||||||||||||||||||||||||||||||||||||||||||||||||||||||||||||||||||||||||||||||||
Dataset | ||||||||||||||||||||||||||||||||||||||||||||||||||||||||||||||||||||||||||||||||||||||||||
| Dataseries X: | ||||||||||||||||||||||||||||||||||||||||||||||||||||||||||||||||||||||||||||||||||||||||||
12.9 12.2 12.8 7.4 6.7 12.6 14.8 13.3 11.1 8.2 11.4 6.4 10.6 12 6.3 11.3 11.9 9.3 9.6 10 6.4 13.8 10.8 13.8 11.7 10.9 16.1 13.4 9.9 11.5 8.3 11.7 9 9.7 10.8 10.3 10.4 12.7 9.3 11.8 5.9 11.4 13 10.8 12.3 11.3 11.8 7.9 12.7 12.3 11.6 6.7 10.9 12.1 13.3 10.1 5.7 14.3 8 13.3 9.3 12.5 7.6 15.9 9.2 9.1 11.1 13 14.5 12.2 12.3 11.4 8.8 14.6 12.6 13 12.6 13.2 9.9 7.7 10.5 13.4 10.9 4.3 10.3 11.8 11.2 11.4 8.6 13.2 12.6 5.6 9.9 8.8 7.7 9 7.3 11.4 13.6 7.9 10.7 10.3 8.3 9.6 14.2 8.5 13.5 4.9 6.4 9.6 11.6 11.1 4.35 12.7 18.1 17.85 16.6 12.6 17.1 19.1 16.1 13.35 18.4 14.7 10.6 12.6 16.2 13.6 18.9 14.1 14.5 16.15 14.75 14.8 12.45 12.65 17.35 8.6 18.4 16.1 11.6 17.75 15.25 17.65 16.35 17.65 13.6 14.35 14.75 18.25 9.9 16 18.25 16.85 14.6 13.85 18.95 15.6 14.85 11.75 18.45 15.9 17.1 16.1 19.9 10.95 18.45 15.1 15 11.35 15.95 18.1 14.6 15.4 15.4 17.6 13.35 19.1 15.35 7.6 13.4 13.9 19.1 15.25 12.9 16.1 17.35 13.15 12.15 12.6 10.35 15.4 9.6 18.2 13.6 14.85 14.75 14.1 14.9 16.25 19.25 13.6 13.6 15.65 12.75 14.6 9.85 12.65 19.2 16.6 11.2 15.25 11.9 13.2 16.35 12.4 15.85 18.15 11.15 15.65 17.75 7.65 12.35 15.6 19.3 15.2 17.1 15.6 18.4 19.05 18.55 19.1 13.1 12.85 9.5 4.5 11.85 13.6 11.7 12.4 13.35 11.4 14.9 19.9 11.2 14.6 17.6 14.05 16.1 13.35 11.85 11.95 14.75 15.15 13.2 16.85 7.85 7.7 12.6 7.85 10.95 12.35 9.95 14.9 16.65 13.4 13.95 15.7 16.85 10.95 15.35 12.2 15.1 17.75 15.2 14.6 16.65 8.1 | ||||||||||||||||||||||||||||||||||||||||||||||||||||||||||||||||||||||||||||||||||||||||||
Tables (Output of Computation) | ||||||||||||||||||||||||||||||||||||||||||||||||||||||||||||||||||||||||||||||||||||||||||
| ||||||||||||||||||||||||||||||||||||||||||||||||||||||||||||||||||||||||||||||||||||||||||
Figures (Output of Computation) | ||||||||||||||||||||||||||||||||||||||||||||||||||||||||||||||||||||||||||||||||||||||||||
Input Parameters & R Code | ||||||||||||||||||||||||||||||||||||||||||||||||||||||||||||||||||||||||||||||||||||||||||
| Parameters (Session): | ||||||||||||||||||||||||||||||||||||||||||||||||||||||||||||||||||||||||||||||||||||||||||
| par1 = grey ; par2 = no ; | ||||||||||||||||||||||||||||||||||||||||||||||||||||||||||||||||||||||||||||||||||||||||||
| Parameters (R input): | ||||||||||||||||||||||||||||||||||||||||||||||||||||||||||||||||||||||||||||||||||||||||||
| par1 = grey ; par2 = no ; | ||||||||||||||||||||||||||||||||||||||||||||||||||||||||||||||||||||||||||||||||||||||||||
| R code (references can be found in the software module): | ||||||||||||||||||||||||||||||||||||||||||||||||||||||||||||||||||||||||||||||||||||||||||
if(par2=='yes') { | ||||||||||||||||||||||||||||||||||||||||||||||||||||||||||||||||||||||||||||||||||||||||||