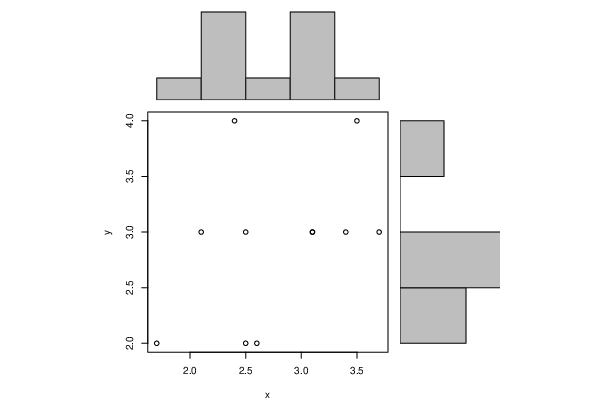
| Pearson Product Moment Correlation - Ungrouped Data | ||
| Statistic | Variable X | Variable Y |
| Mean | 2.78181818181818 | 2.90909090909091 |
| Biased Variance | 0.35603305785124 | 0.446280991735537 |
| Biased Standard Deviation | 0.596685057506252 | 0.668042657122685 |
| Covariance | 0.188181818181818 | |
| Correlation | 0.429176188245694 | |
| Determination | 0.184192200557103 | |
| T-Test | 1.42548596740826 | |
| p-value (2 sided) | 0.187762787388688 | |
| p-value (1 sided) | 0.0938813936943442 | |
| 95% CI of Correlation | [-0.229882568994314, 0.81836216659881] | |
| Degrees of Freedom | 9 | |
| Number of Observations | 11 | |
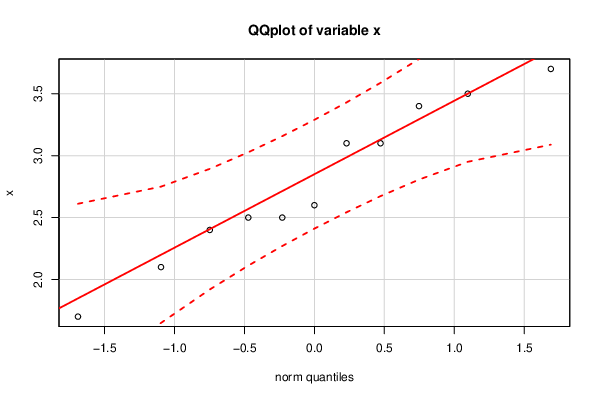
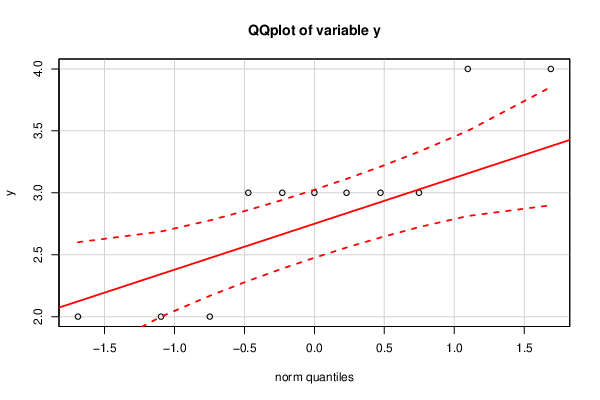
| Normality Tests |
> jarque.x Jarque-Bera Normality Test data: x JB = 0.49472, p-value = 0.7809 alternative hypothesis: greater |
> jarque.y Jarque-Bera Normality Test data: y JB = 0.29342, p-value = 0.8635 alternative hypothesis: greater |
> ad.x Anderson-Darling normality test data: x A = 0.25544, p-value = 0.6524 |
> ad.y Anderson-Darling normality test data: y A = 0.95463, p-value = 0.00996 |