| Multiple Linear Regression - Estimated Regression Equation |
| GWSUM[t] = + 12.8778 -0.0308809IKSUM[t] + 0.0149087KVDDSUM[t] -0.0283485SKEOUSUM[t] + e[t] |
| Multiple Linear Regression - Ordinary Least Squares | |||||
| Variable | Parameter | S.D. | T-STAT H0: parameter = 0 | 2-tail p-value | 1-tail p-value |
| (Intercept) | +12.88 | 2.786 | +4.6230e+00 | 1.413e-05 | 7.064e-06 |
| IKSUM | -0.03088 | 0.09343 | -3.3050e-01 | 0.7419 | 0.3709 |
| KVDDSUM | +0.01491 | 0.07842 | +1.9010e-01 | 0.8497 | 0.4248 |
| SKEOUSUM | -0.02835 | 0.09038 | -3.1370e-01 | 0.7546 | 0.3773 |
| Multiple Linear Regression - Regression Statistics | |
| Multiple R | 0.05693 |
| R-squared | 0.003241 |
| Adjusted R-squared | -0.03368 |
| F-TEST (value) | 0.0878 |
| F-TEST (DF numerator) | 3 |
| F-TEST (DF denominator) | 81 |
| p-value | 0.9665 |
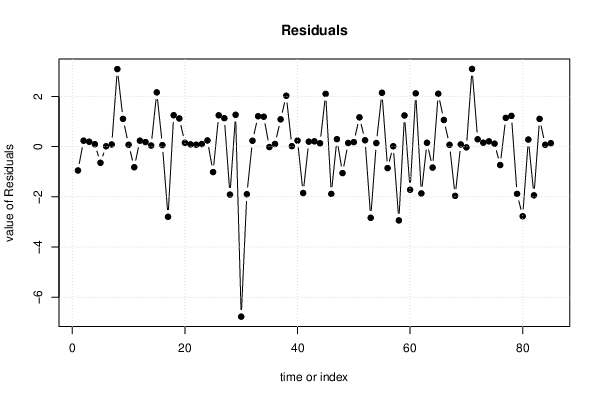
| Multiple Linear Regression - Residual Statistics | |
| Residual Standard Deviation | 1.506 |
| Sum Squared Residuals | 183.7 |
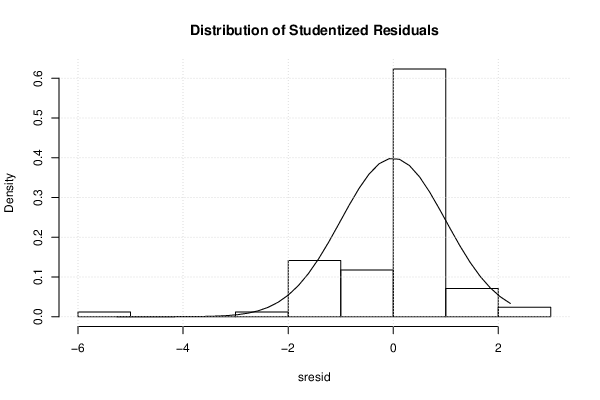
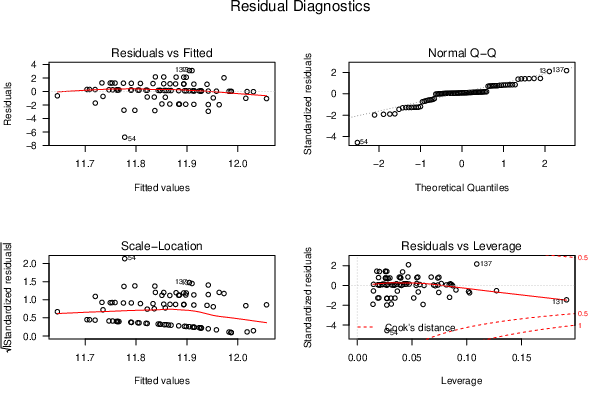
| Menu of Residual Diagnostics | |
| Description | Link |
| Histogram | Compute |
| Central Tendency | Compute |
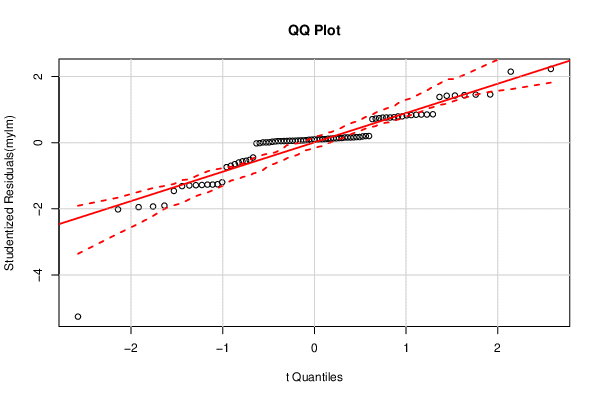
| QQ Plot | Compute |
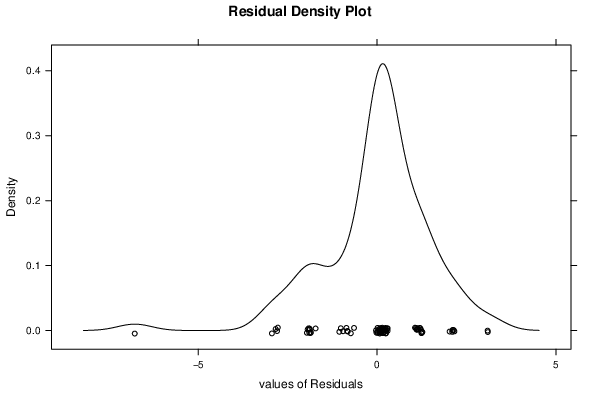
| Kernel Density Plot | Compute |
| Skewness/Kurtosis Test | Compute |
| Skewness-Kurtosis Plot | Compute |
| Harrell-Davis Plot | Compute |
| Bootstrap Plot -- Central Tendency | Compute |
| Blocked Bootstrap Plot -- Central Tendency | Compute |
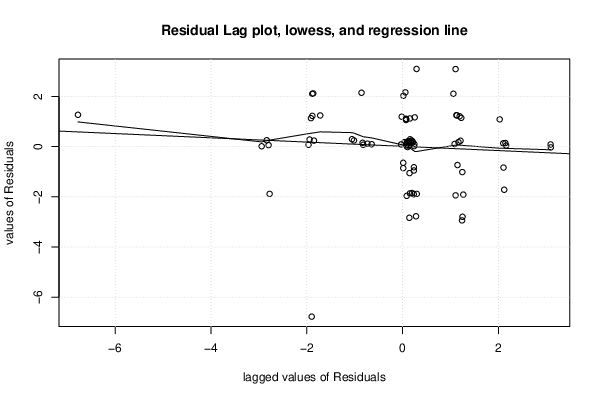
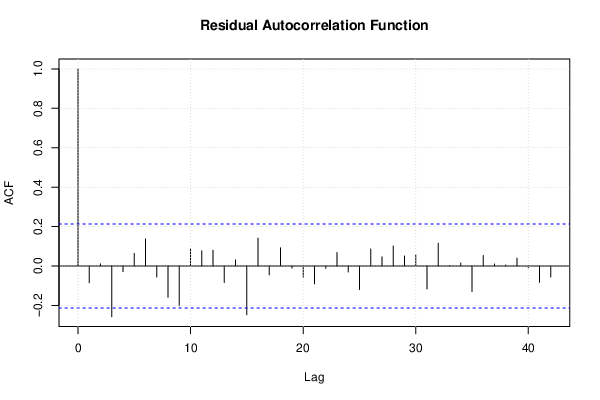
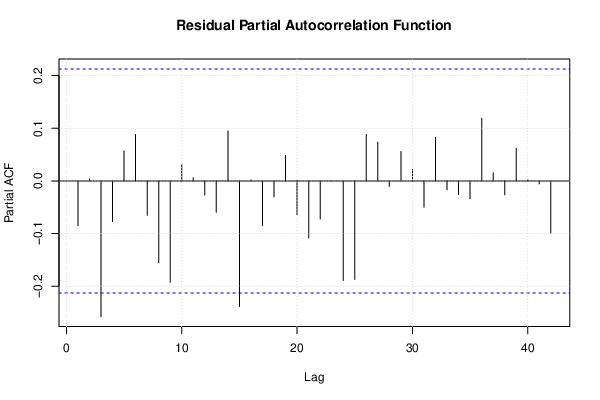
| (Partial) Autocorrelation Plot | Compute |
| Spectral Analysis | Compute |
| Tukey lambda PPCC Plot | Compute |
| Box-Cox Normality Plot | Compute |
| Summary Statistics | Compute |
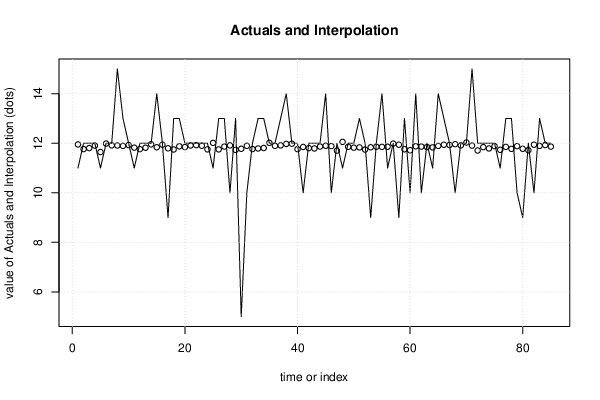
| Multiple Linear Regression - Actuals, Interpolation, and Residuals | |||
| Time or Index | Actuals | Interpolation Forecast | Residuals Prediction Error |
| 1 | 11 | 11.95 | -0.9517 |
| 2 | 12 | 11.76 | 0.2362 |
| 3 | 12 | 11.81 | 0.194 |
| 4 | 12 | 11.9 | 0.09551 |
| 5 | 11 | 11.65 | -0.6454 |
| 6 | 12 | 11.99 | 0.01271 |
| 7 | 12 | 11.91 | 0.08538 |
| 8 | 15 | 11.91 | 3.09 |
| 9 | 13 | 11.89 | 1.106 |
| 10 | 12 | 11.93 | 0.07301 |
| 11 | 11 | 11.82 | -0.822 |
| 12 | 12 | 11.76 | 0.2362 |
| 13 | 12 | 11.82 | 0.1806 |
| 14 | 12 | 11.96 | 0.04212 |
| 15 | 14 | 11.84 | 2.162 |
| 16 | 12 | 11.94 | 0.0581 |
| 17 | 9 | 11.8 | -2.798 |
| 18 | 13 | 11.75 | 1.251 |
| 19 | 13 | 11.88 | 1.122 |
| 20 | 12 | 11.85 | 0.1533 |
| 21 | 12 | 11.91 | 0.08898 |
| 22 | 12 | 11.92 | 0.07594 |
| 23 | 12 | 11.9 | 0.1014 |
| 24 | 12 | 11.75 | 0.246 |
| 25 | 11 | 12.02 | -1.016 |
| 26 | 13 | 11.75 | 1.247 |
| 27 | 13 | 11.87 | 1.133 |
| 28 | 10 | 11.91 | -1.914 |
| 29 | 13 | 11.73 | 1.267 |
| 30 | 5 | 11.78 | -6.778 |
| 31 | 10 | 11.9 | -1.898 |
| 32 | 12 | 11.77 | 0.2337 |
| 33 | 13 | 11.79 | 1.209 |
| 34 | 13 | 11.81 | 1.191 |
| 35 | 12 | 12.02 | -0.01817 |
| 36 | 12 | 11.89 | 0.105 |
| 37 | 13 | 11.91 | 1.086 |
| 38 | 14 | 11.97 | 2.027 |
| 39 | 12 | 11.98 | 0.01737 |
| 40 | 12 | 11.76 | 0.2387 |
| 41 | 10 | 11.85 | -1.851 |
| 42 | 12 | 11.8 | 0.1965 |
| 43 | 12 | 11.79 | 0.2104 |
| 44 | 12 | 11.87 | 0.1312 |
| 45 | 14 | 11.9 | 2.101 |
| 46 | 10 | 11.89 | -1.885 |
| 47 | 12 | 11.7 | 0.2965 |
| 48 | 11 | 12.06 | -1.056 |
| 49 | 12 | 11.86 | 0.1446 |
| 50 | 12 | 11.82 | 0.178 |
| 51 | 13 | 11.83 | 1.167 |
| 52 | 12 | 11.75 | 0.2532 |
| 53 | 9 | 11.84 | -2.837 |
| 54 | 12 | 11.86 | 0.141 |
| 55 | 14 | 11.85 | 2.146 |
| 56 | 11 | 11.86 | -0.8575 |
| 57 | 12 | 11.99 | 0.01378 |
| 58 | 9 | 11.94 | -2.942 |
| 59 | 13 | 11.76 | 1.241 |
| 60 | 10 | 11.72 | -1.72 |
| 61 | 14 | 11.88 | 2.121 |
| 62 | 10 | 11.87 | -1.866 |
| 63 | 12 | 11.85 | 0.1522 |
| 64 | 11 | 11.84 | -0.8358 |
| 65 | 14 | 11.89 | 2.106 |
| 66 | 13 | 11.94 | 1.061 |
| 67 | 12 | 11.93 | 0.07154 |
| 68 | 10 | 11.96 | -1.963 |
| 69 | 12 | 11.91 | 0.08645 |
| 70 | 12 | 12.03 | -0.03054 |
| 71 | 15 | 11.9 | 3.095 |
| 72 | 12 | 11.71 | 0.2914 |
| 73 | 12 | 11.84 | 0.1566 |
| 74 | 12 | 11.79 | 0.2089 |
| 75 | 12 | 11.88 | 0.1163 |
| 76 | 11 | 11.74 | -0.7351 |
| 77 | 13 | 11.85 | 1.146 |
| 78 | 13 | 11.78 | 1.225 |
| 79 | 10 | 11.88 | -1.884 |
| 80 | 9 | 11.78 | -2.776 |
| 81 | 12 | 11.72 | 0.2805 |
| 82 | 10 | 11.94 | -1.942 |
| 83 | 13 | 11.89 | 1.106 |
| 84 | 12 | 11.93 | 0.0726 |
| 85 | 12 | 11.86 | 0.1362 |
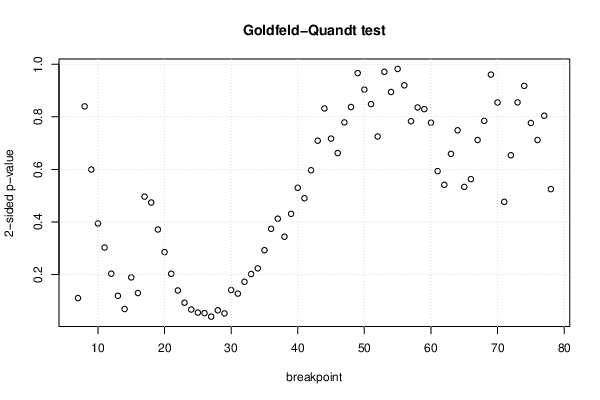
| Goldfeld-Quandt test for Heteroskedasticity | |||
| p-values | Alternative Hypothesis | ||
| breakpoint index | greater | 2-sided | less |
| 7 | 0.05528 | 0.1106 | 0.9447 |
| 8 | 0.42 | 0.8399 | 0.58 |
| 9 | 0.2998 | 0.5996 | 0.7002 |
| 10 | 0.1973 | 0.3946 | 0.8027 |
| 11 | 0.1515 | 0.303 | 0.8485 |
| 12 | 0.1017 | 0.2033 | 0.8983 |
| 13 | 0.0596 | 0.1192 | 0.9404 |
| 14 | 0.03443 | 0.06887 | 0.9656 |
| 15 | 0.0946 | 0.1892 | 0.9054 |
| 16 | 0.0649 | 0.1298 | 0.9351 |
| 17 | 0.2483 | 0.4966 | 0.7517 |
| 18 | 0.2371 | 0.4742 | 0.7629 |
| 19 | 0.1858 | 0.3715 | 0.8142 |
| 20 | 0.1427 | 0.2854 | 0.8573 |
| 21 | 0.1015 | 0.2031 | 0.8985 |
| 22 | 0.06975 | 0.1395 | 0.9303 |
| 23 | 0.0464 | 0.0928 | 0.9536 |
| 24 | 0.03349 | 0.06698 | 0.9665 |
| 25 | 0.02771 | 0.05541 | 0.9723 |
| 26 | 0.02656 | 0.05311 | 0.9734 |
| 27 | 0.01994 | 0.03987 | 0.9801 |
| 28 | 0.03201 | 0.06402 | 0.968 |
| 29 | 0.02615 | 0.05231 | 0.9738 |
| 30 | 0.9294 | 0.1411 | 0.07055 |
| 31 | 0.9362 | 0.1275 | 0.06377 |
| 32 | 0.9138 | 0.1725 | 0.08624 |
| 33 | 0.899 | 0.2021 | 0.101 |
| 34 | 0.8882 | 0.2236 | 0.1118 |
| 35 | 0.8536 | 0.2927 | 0.1464 |
| 36 | 0.813 | 0.374 | 0.187 |
| 37 | 0.7937 | 0.4125 | 0.2063 |
| 38 | 0.8281 | 0.3439 | 0.1719 |
| 39 | 0.7845 | 0.4311 | 0.2155 |
| 40 | 0.735 | 0.5301 | 0.265 |
| 41 | 0.7548 | 0.4904 | 0.2452 |
| 42 | 0.7015 | 0.5969 | 0.2985 |
| 43 | 0.6453 | 0.7094 | 0.3547 |
| 44 | 0.5839 | 0.8321 | 0.4161 |
| 45 | 0.6414 | 0.7172 | 0.3586 |
| 46 | 0.6689 | 0.6623 | 0.3311 |
| 47 | 0.6105 | 0.779 | 0.3895 |
| 48 | 0.5812 | 0.8375 | 0.4188 |
| 49 | 0.5167 | 0.9666 | 0.4833 |
| 50 | 0.4519 | 0.9038 | 0.5481 |
| 51 | 0.4243 | 0.8485 | 0.5757 |
| 52 | 0.3626 | 0.7252 | 0.6374 |
| 53 | 0.5143 | 0.9714 | 0.4857 |
| 54 | 0.4474 | 0.8947 | 0.5526 |
| 55 | 0.5088 | 0.9823 | 0.4912 |
| 56 | 0.46 | 0.92 | 0.54 |
| 57 | 0.3917 | 0.7834 | 0.6083 |
| 58 | 0.582 | 0.8359 | 0.418 |
| 59 | 0.5853 | 0.8293 | 0.4147 |
| 60 | 0.611 | 0.778 | 0.389 |
| 61 | 0.7032 | 0.5936 | 0.2968 |
| 62 | 0.7292 | 0.5415 | 0.2708 |
| 63 | 0.6703 | 0.6593 | 0.3297 |
| 64 | 0.6255 | 0.749 | 0.3745 |
| 65 | 0.7332 | 0.5336 | 0.2668 |
| 66 | 0.7185 | 0.5631 | 0.2815 |
| 67 | 0.6441 | 0.7119 | 0.3559 |
| 68 | 0.6076 | 0.7849 | 0.3924 |
| 69 | 0.5196 | 0.9608 | 0.4804 |
| 70 | 0.4274 | 0.8548 | 0.5726 |
| 71 | 0.7616 | 0.4768 | 0.2384 |
| 72 | 0.673 | 0.6541 | 0.327 |
| 73 | 0.5724 | 0.8552 | 0.4276 |
| 74 | 0.4589 | 0.9179 | 0.5411 |
| 75 | 0.3883 | 0.7767 | 0.6117 |
| 76 | 0.356 | 0.712 | 0.644 |
| 77 | 0.4022 | 0.8044 | 0.5978 |
| 78 | 0.2625 | 0.5249 | 0.7375 |
| Meta Analysis of Goldfeld-Quandt test for Heteroskedasticity | |||
| Description | # significant tests | % significant tests | OK/NOK |
| 1% type I error level | 0 | 0 | OK |
| 5% type I error level | 1 | 0.0138889 | OK |
| 10% type I error level | 8 | 0.111111 | NOK |
| Ramsey RESET F-Test for powers (2 and 3) of fitted values |
> reset_test_fitted RESET test data: mylm RESET = 0.61606, df1 = 2, df2 = 79, p-value = 0.5426 |
| Ramsey RESET F-Test for powers (2 and 3) of regressors |
> reset_test_regressors RESET test data: mylm RESET = 0.93052, df1 = 6, df2 = 75, p-value = 0.4782 |
| Ramsey RESET F-Test for powers (2 and 3) of principal components |
> reset_test_principal_components RESET test data: mylm RESET = 0.84446, df1 = 2, df2 = 79, p-value = 0.4336 |
| Variance Inflation Factors (Multicollinearity) |
> vif IKSUM KVDDSUM SKEOUSUM 1.036213 1.022608 1.018379 |