| Pearson Product Moment Correlation - Ungrouped Data | ||
| Statistic | Variable X | Variable Y |
| Mean | 5.76666666666667 | 2.94666666666667 |
| Biased Variance | 19.1622222222222 | 0.322488888888889 |
| Biased Standard Deviation | 4.37746755810049 | 0.567881051707916 |
| Covariance | -1.27761904761905 | |
| Correlation | -0.479686880291384 | |
| Determination | 0.230099503123681 | |
| T-Test | -1.97111615159914 | |
| p-value (2 sided) | 0.0703807962319273 | |
| p-value (1 sided) | 0.0351903981159637 | |
| 95% CI of Correlation | [-0.796282578155583, 0.0431884878867584] | |
| Degrees of Freedom | 13 | |
| Number of Observations | 15 | |
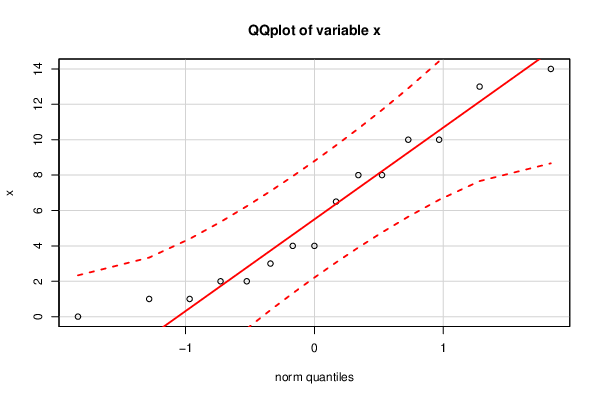
| Normality Tests |
> jarque.x Jarque-Bera Normality Test data: x JB = 1.2137, p-value = 0.5451 alternative hypothesis: greater |
> jarque.y Jarque-Bera Normality Test data: y JB = 0.72371, p-value = 0.6964 alternative hypothesis: greater |
> ad.x Anderson-Darling normality test data: x A = 0.44281, p-value = 0.2479 |
> ad.y Anderson-Darling normality test data: y A = 0.27396, p-value = 0.6112 |