| Multiple Linear Regression - Estimated Regression Equation |
| NEUROTICISM[t] = + 3.63021 -0.263251EXTRAVERSION[t] + 0.442822AGREEABLENESS[t] + 0.207943CONSCIENTIOUSNESS[t] -0.441248OPENNESS[t] + e[t] |
| Multiple Linear Regression - Ordinary Least Squares | |||||
| Variable | Parameter | S.D. | T-STAT H0: parameter = 0 | 2-tail p-value | 1-tail p-value |
| (Intercept) | +3.63 | 0.811 | +4.4760e+00 | 2.198e-05 | 1.099e-05 |
| EXTRAVERSION | -0.2632 | 0.1025 | -2.5680e+00 | 0.01186 | 0.005932 |
| AGREEABLENESS | +0.4428 | 0.1066 | +4.1540e+00 | 7.362e-05 | 3.681e-05 |
| CONSCIENTIOUSNESS | +0.2079 | 0.1511 | +1.3760e+00 | 0.1721 | 0.08603 |
| OPENNESS | -0.4412 | 0.1379 | -3.2000e+00 | 0.001892 | 0.000946 |
| Multiple Linear Regression - Regression Statistics | |
| Multiple R | 0.5545 |
| R-squared | 0.3075 |
| Adjusted R-squared | 0.2771 |
| F-TEST (value) | 10.1 |
| F-TEST (DF numerator) | 4 |
| F-TEST (DF denominator) | 91 |
| p-value | 8.217e-07 |
| Multiple Linear Regression - Residual Statistics | |
| Residual Standard Deviation | 1.202 |
| Sum Squared Residuals | 131.5 |
| Menu of Residual Diagnostics | |
| Description | Link |
| Histogram | Compute |
| Central Tendency | Compute |
| QQ Plot | Compute |
| Kernel Density Plot | Compute |
| Skewness/Kurtosis Test | Compute |
| Skewness-Kurtosis Plot | Compute |
| Harrell-Davis Plot | Compute |
| Bootstrap Plot -- Central Tendency | Compute |
| Blocked Bootstrap Plot -- Central Tendency | Compute |
| (Partial) Autocorrelation Plot | Compute |
| Spectral Analysis | Compute |
| Tukey lambda PPCC Plot | Compute |
| Box-Cox Normality Plot | Compute |
| Summary Statistics | Compute |
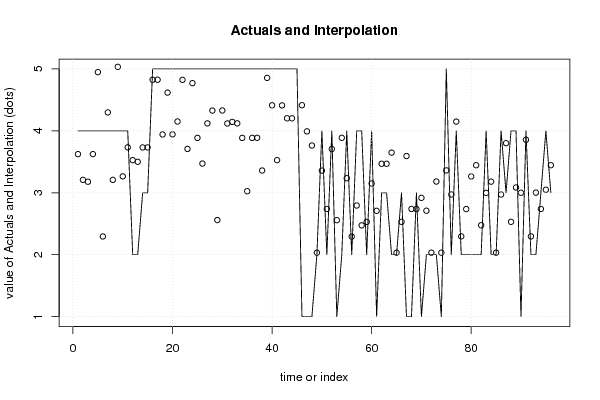
| Multiple Linear Regression - Actuals, Interpolation, and Residuals | |||
| Time or Index | Actuals | Interpolation Forecast | Residuals Prediction Error |
| 1 | 4 | 3.625 | 0.3752 |
| 2 | 4 | 3.209 | 0.7911 |
| 3 | 4 | 3.179 | 0.8212 |
| 4 | 4 | 3.625 | 0.3752 |
| 5 | 4 | 4.949 | -0.9485 |
| 6 | 4 | 2.295 | 1.705 |
| 7 | 4 | 4.298 | -0.2978 |
| 8 | 4 | 3.209 | 0.7911 |
| 9 | 4 | 5.034 | -1.034 |
| 10 | 4 | 3.266 | 0.7344 |
| 11 | 4 | 3.734 | 0.2662 |
| 12 | 2 | 3.527 | -1.527 |
| 13 | 2 | 3.501 | -1.501 |
| 14 | 3 | 3.732 | -0.7323 |
| 15 | 3 | 3.732 | -0.7323 |
| 16 | 5 | 4.826 | 0.1742 |
| 17 | 5 | 4.826 | 0.1742 |
| 18 | 5 | 3.942 | 1.058 |
| 19 | 5 | 4.618 | 0.3821 |
| 20 | 5 | 3.943 | 1.057 |
| 21 | 5 | 4.151 | 0.8487 |
| 22 | 5 | 4.824 | 0.1757 |
| 23 | 5 | 3.708 | 1.292 |
| 24 | 5 | 4.771 | 0.2295 |
| 25 | 5 | 3.886 | 1.114 |
| 26 | 5 | 3.472 | 1.528 |
| 27 | 5 | 4.121 | 0.8787 |
| 28 | 5 | 4.328 | 0.6723 |
| 29 | 5 | 2.56 | 2.44 |
| 30 | 5 | 4.329 | 0.6707 |
| 31 | 5 | 4.12 | 0.8802 |
| 32 | 5 | 4.145 | 0.8549 |
| 33 | 5 | 4.121 | 0.8787 |
| 34 | 5 | 3.886 | 1.114 |
| 35 | 5 | 3.026 | 1.974 |
| 36 | 5 | 3.886 | 1.114 |
| 37 | 5 | 3.888 | 1.112 |
| 38 | 5 | 3.36 | 1.64 |
| 39 | 5 | 4.856 | 0.1442 |
| 40 | 5 | 4.413 | 0.587 |
| 41 | 5 | 3.527 | 1.473 |
| 42 | 5 | 4.411 | 0.5886 |
| 43 | 5 | 4.203 | 0.7965 |
| 44 | 5 | 4.203 | 0.7965 |
| 45 | 5 | 5.297 | -0.297 |
| 46 | 1 | 4.415 | -3.415 |
| 47 | 1 | 3.992 | -2.992 |
| 48 | 1 | 3.764 | -2.764 |
| 49 | 2 | 2.033 | -0.03307 |
| 50 | 4 | 3.358 | 0.6416 |
| 51 | 2 | 2.739 | -0.7391 |
| 52 | 4 | 3.707 | 0.2931 |
| 53 | 1 | 2.558 | -1.558 |
| 54 | 2 | 3.888 | -1.888 |
| 55 | 4 | 3.236 | 0.7643 |
| 56 | 2 | 2.293 | -0.2933 |
| 57 | 4 | 2.794 | 1.206 |
| 58 | 4 | 2.474 | 1.526 |
| 59 | 2 | 2.53 | -0.5296 |
| 60 | 4 | 3.15 | 0.8496 |
| 61 | 1 | 2.709 | -1.709 |
| 62 | 3 | 3.469 | -0.469 |
| 63 | 3 | 3.469 | -0.469 |
| 64 | 2 | 3.649 | -1.649 |
| 65 | 2 | 2.033 | -0.03307 |
| 66 | 3 | 2.531 | 0.4688 |
| 67 | 1 | 3.593 | -2.593 |
| 68 | 1 | 2.739 | -1.739 |
| 69 | 3 | 2.738 | 0.2624 |
| 70 | 1 | 2.919 | -1.919 |
| 71 | 2 | 2.711 | -0.7108 |
| 72 | 2 | 2.033 | -0.03307 |
| 73 | 2 | 3.182 | -1.182 |
| 74 | 1 | 2.033 | -1.033 |
| 75 | 5 | 3.362 | 1.638 |
| 76 | 2 | 2.972 | -0.9724 |
| 77 | 4 | 4.15 | -0.1497 |
| 78 | 2 | 2.296 | -0.2963 |
| 79 | 2 | 2.738 | -0.7376 |
| 80 | 2 | 3.264 | -1.264 |
| 81 | 2 | 3.445 | -1.445 |
| 82 | 2 | 2.476 | -0.4759 |
| 83 | 4 | 2.999 | 1.001 |
| 84 | 2 | 3.18 | -1.18 |
| 85 | 2 | 2.033 | -0.03307 |
| 86 | 4 | 2.972 | 1.028 |
| 87 | 3 | 3.801 | -0.8012 |
| 88 | 4 | 2.531 | 1.469 |
| 89 | 4 | 3.086 | 0.9139 |
| 90 | 1 | 3.001 | -2.001 |
| 91 | 4 | 3.857 | 0.1435 |
| 92 | 2 | 2.296 | -0.2963 |
| 93 | 2 | 3.002 | -1.002 |
| 94 | 3 | 2.739 | 0.2609 |
| 95 | 4 | 3.05 | 0.95 |
| 96 | 3 | 3.445 | -0.4452 |
| Goldfeld-Quandt test for Heteroskedasticity | |||
| p-values | Alternative Hypothesis | ||
| breakpoint index | greater | 2-sided | less |
| 8 | 9.399e-46 | 1.88e-45 | 1 |
| 9 | 0 | 0 | 1 |
| 10 | 0 | 0 | 1 |
| 11 | 9.889e-91 | 1.978e-90 | 1 |
| 12 | 0.01314 | 0.02628 | 0.9869 |
| 13 | 0.0434 | 0.0868 | 0.9566 |
| 14 | 0.02225 | 0.0445 | 0.9778 |
| 15 | 0.01089 | 0.02178 | 0.9891 |
| 16 | 0.02835 | 0.0567 | 0.9717 |
| 17 | 0.03348 | 0.06696 | 0.9665 |
| 18 | 0.04796 | 0.09593 | 0.952 |
| 19 | 0.05066 | 0.1013 | 0.9493 |
| 20 | 0.05256 | 0.1051 | 0.9474 |
| 21 | 0.03829 | 0.07658 | 0.9617 |
| 22 | 0.02751 | 0.05502 | 0.9725 |
| 23 | 0.0221 | 0.0442 | 0.9779 |
| 24 | 0.01341 | 0.02682 | 0.9866 |
| 25 | 0.009772 | 0.01954 | 0.9902 |
| 26 | 0.01471 | 0.02943 | 0.9853 |
| 27 | 0.01135 | 0.02269 | 0.9887 |
| 28 | 0.007385 | 0.01477 | 0.9926 |
| 29 | 0.01153 | 0.02305 | 0.9885 |
| 30 | 0.007494 | 0.01499 | 0.9925 |
| 31 | 0.006119 | 0.01224 | 0.9939 |
| 32 | 0.007923 | 0.01585 | 0.9921 |
| 33 | 0.00621 | 0.01242 | 0.9938 |
| 34 | 0.004758 | 0.009515 | 0.9952 |
| 35 | 0.007793 | 0.01559 | 0.9922 |
| 36 | 0.006217 | 0.01243 | 0.9938 |
| 37 | 0.0055 | 0.011 | 0.9945 |
| 38 | 0.005572 | 0.01114 | 0.9944 |
| 39 | 0.003885 | 0.00777 | 0.9961 |
| 40 | 0.003007 | 0.006014 | 0.997 |
| 41 | 0.003089 | 0.006178 | 0.9969 |
| 42 | 0.002389 | 0.004778 | 0.9976 |
| 43 | 0.002284 | 0.004568 | 0.9977 |
| 44 | 0.002416 | 0.004833 | 0.9976 |
| 45 | 0.002249 | 0.004498 | 0.9978 |
| 46 | 0.07774 | 0.1555 | 0.9223 |
| 47 | 0.3464 | 0.6929 | 0.6536 |
| 48 | 0.6014 | 0.7972 | 0.3986 |
| 49 | 0.6475 | 0.705 | 0.3525 |
| 50 | 0.6482 | 0.7036 | 0.3518 |
| 51 | 0.6685 | 0.6631 | 0.3315 |
| 52 | 0.6288 | 0.7424 | 0.3712 |
| 53 | 0.7324 | 0.5352 | 0.2676 |
| 54 | 0.7878 | 0.4244 | 0.2122 |
| 55 | 0.7655 | 0.469 | 0.2345 |
| 56 | 0.7361 | 0.5277 | 0.2639 |
| 57 | 0.7375 | 0.5249 | 0.2625 |
| 58 | 0.7859 | 0.4283 | 0.2141 |
| 59 | 0.7604 | 0.4793 | 0.2396 |
| 60 | 0.7798 | 0.4404 | 0.2202 |
| 61 | 0.8391 | 0.3218 | 0.1609 |
| 62 | 0.8011 | 0.3977 | 0.1989 |
| 63 | 0.7587 | 0.4826 | 0.2413 |
| 64 | 0.7984 | 0.4031 | 0.2016 |
| 65 | 0.7589 | 0.4822 | 0.2411 |
| 66 | 0.7074 | 0.5853 | 0.2926 |
| 67 | 0.8626 | 0.2748 | 0.1374 |
| 68 | 0.8952 | 0.2097 | 0.1048 |
| 69 | 0.8722 | 0.2556 | 0.1278 |
| 70 | 0.9132 | 0.1736 | 0.08682 |
| 71 | 0.9064 | 0.1873 | 0.09365 |
| 72 | 0.8723 | 0.2554 | 0.1277 |
| 73 | 0.8684 | 0.2633 | 0.1316 |
| 74 | 0.8519 | 0.2963 | 0.1481 |
| 75 | 0.9267 | 0.1466 | 0.07329 |
| 76 | 0.9249 | 0.1503 | 0.07514 |
| 77 | 0.9013 | 0.1974 | 0.0987 |
| 78 | 0.8587 | 0.2826 | 0.1413 |
| 79 | 0.8107 | 0.3787 | 0.1893 |
| 80 | 0.7903 | 0.4195 | 0.2097 |
| 81 | 0.7925 | 0.415 | 0.2075 |
| 82 | 0.717 | 0.566 | 0.283 |
| 83 | 0.9175 | 0.165 | 0.08251 |
| 84 | 0.8723 | 0.2555 | 0.1277 |
| 85 | 0.795 | 0.41 | 0.205 |
| 86 | 0.7257 | 0.5485 | 0.2743 |
| 87 | 0.6851 | 0.6297 | 0.3149 |
| 88 | 0.5312 | 0.9376 | 0.4688 |
| Meta Analysis of Goldfeld-Quandt test for Heteroskedasticity | |||
| Description | # significant tests | % significant tests | OK/NOK |
| 1% type I error level | 12 | 0.1481 | NOK |
| 5% type I error level | 30 | 0.37037 | NOK |
| 10% type I error level | 36 | 0.444444 | NOK |
| Ramsey RESET F-Test for powers (2 and 3) of fitted values |
> reset_test_fitted RESET test data: mylm RESET = 0.19327, df1 = 2, df2 = 89, p-value = 0.8246 |
| Ramsey RESET F-Test for powers (2 and 3) of regressors |
> reset_test_regressors RESET test data: mylm RESET = 1.3648, df1 = 8, df2 = 83, p-value = 0.2241 |
| Ramsey RESET F-Test for powers (2 and 3) of principal components |
> reset_test_principal_components RESET test data: mylm RESET = 1.6751, df1 = 2, df2 = 89, p-value = 0.1931 |
| Variance Inflation Factors (Multicollinearity) |
> vif
     EXTRAVERSION     AGREEABLENESS CONSCIENTIOUSNESS          OPENNESS
         1.095885          1.067808          1.200097          1.263476
|