| Multiple Linear Regression - Estimated Regression Equation |
| a[t] = + 25.2267 -0.211086b[t] -0.477191c[t] + 0.0347213d[t] -0.152048t + e[t] |
| Multiple Linear Regression - Ordinary Least Squares | |||||
| Variable | Parameter | S.D. | T-STAT H0: parameter = 0 | 2-tail p-value | 1-tail p-value |
| (Intercept) | +25.23 | 6.626 | +3.8070e+00 | 0.01253 | 0.006267 |
| b | -0.2111 | 0.48 | -4.3980e-01 | 0.6784 | 0.3392 |
| c | -0.4772 | 0.479 | -9.9610e-01 | 0.3649 | 0.1825 |
| d | +0.03472 | 0.5566 | +6.2380e-02 | 0.9527 | 0.4763 |
| t | -0.152 | 0.1316 | -1.1550e+00 | 0.3003 | 0.1501 |
| Multiple Linear Regression - Regression Statistics | |
| Multiple R | 0.7168 |
| R-squared | 0.5138 |
| Adjusted R-squared | 0.1248 |
| F-TEST (value) | 1.321 |
| F-TEST (DF numerator) | 4 |
| F-TEST (DF denominator) | 5 |
| p-value | 0.3766 |
| Multiple Linear Regression - Residual Statistics | |
| Residual Standard Deviation | 1.006 |
| Sum Squared Residuals | 5.057 |
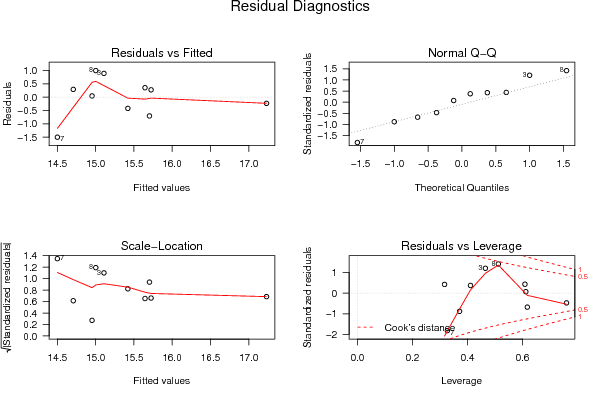
| Menu of Residual Diagnostics | |
| Description | Link |
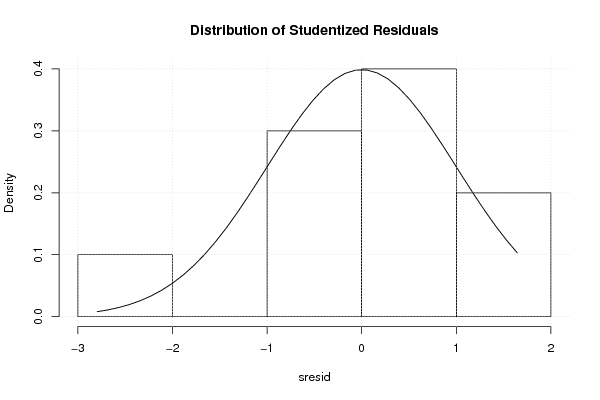
| Histogram | Compute |
| Central Tendency | Compute |
| QQ Plot | Compute |
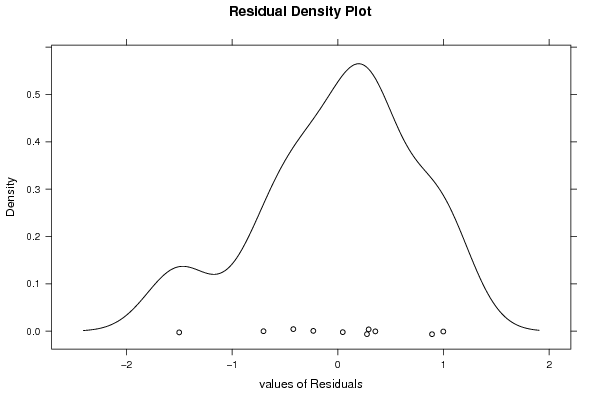
| Kernel Density Plot | Compute |
| Skewness/Kurtosis Test | Compute |
| Skewness-Kurtosis Plot | Compute |
| Harrell-Davis Plot | Compute |
| Bootstrap Plot -- Central Tendency | Compute |
| Blocked Bootstrap Plot -- Central Tendency | Compute |
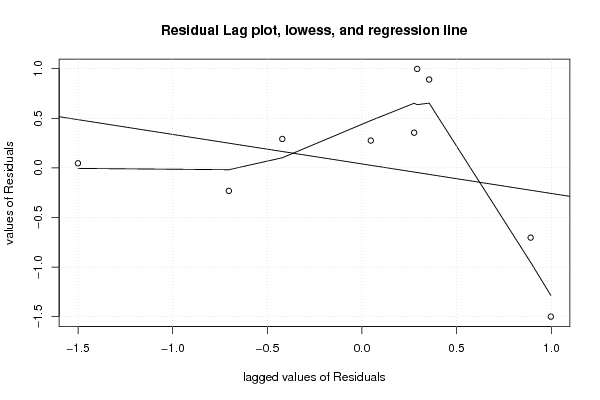
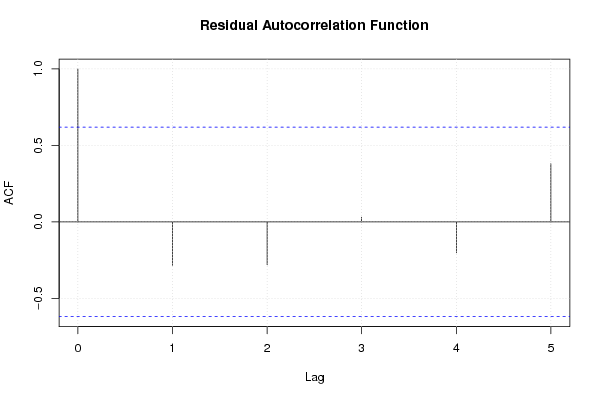
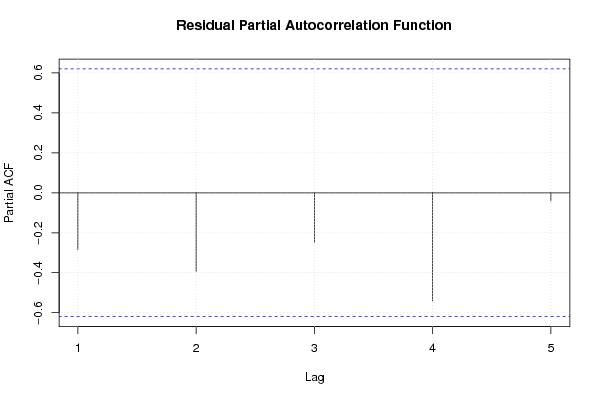
| (Partial) Autocorrelation Plot | Compute |
| Spectral Analysis | Compute |
| Tukey lambda PPCC Plot | Compute |
| Box-Cox Normality Plot | Compute |
| Summary Statistics | Compute |
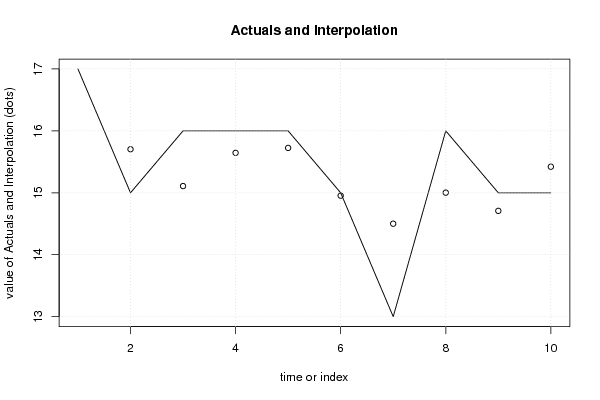
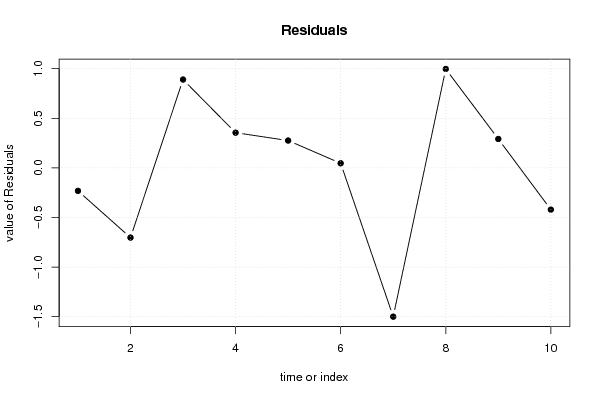
| Multiple Linear Regression - Actuals, Interpolation, and Residuals | |||
| Time or Index | Actuals | Interpolation Forecast | Residuals Prediction Error |
| 1 | 17 | 17.23 | -0.232 |
| 2 | 15 | 15.7 | -0.7034 |
| 3 | 16 | 15.11 | 0.8911 |
| 4 | 16 | 15.65 | 0.3549 |
| 5 | 16 | 15.72 | 0.2755 |
| 6 | 15 | 14.95 | 0.04643 |
| 7 | 13 | 14.5 | -1.501 |
| 8 | 16 | 15 | 0.9978 |
| 9 | 15 | 14.71 | 0.2915 |
| 10 | 15 | 15.42 | -0.4211 |
| Ramsey RESET F-Test for powers (2 and 3) of fitted values |
> reset_test_fitted RESET test data: mylm RESET = 2.3534, df1 = 2, df2 = 3, p-value = 0.2429 |
| Ramsey RESET F-Test for powers (2 and 3) of regressors |
> reset_test_regressors RESET test data: mylm RESET = -Inf, df1 = 8, df2 = -3, p-value = NA |
| Ramsey RESET F-Test for powers (2 and 3) of principal components |
> reset_test_principal_components RESET test data: mylm RESET = 0.20858, df1 = 2, df2 = 3, p-value = 0.8226 |
| Variance Inflation Factors (Multicollinearity) |
> vif
       b        c        d        t
1.936188 1.724591 1.715467 1.413556
|