| Pearson Product Moment Correlation - Ungrouped Data | ||
| Statistic | Variable X | Variable Y |
| Mean | 32.962962962963 | 89.4166666666667 |
| Biased Variance | 26.7764060356653 | 3.65740740740741 |
| Biased Standard Deviation | 5.17459235454014 | 1.9124349420065 |
| Covariance | -0.418589743589745 | |
| Correlation | -0.0407319642721479 | |
| Determination | 0.00165909291346754 | |
| T-Test | -0.203828977156941 | |
| p-value (2 sided) | 0.840137267229248 | |
| p-value (1 sided) | 0.420068633614624 | |
| 95% CI of Correlation | [-0.414332593869995, 0.344616217895029] | |
| Degrees of Freedom | 25 | |
| Number of Observations | 27 | |
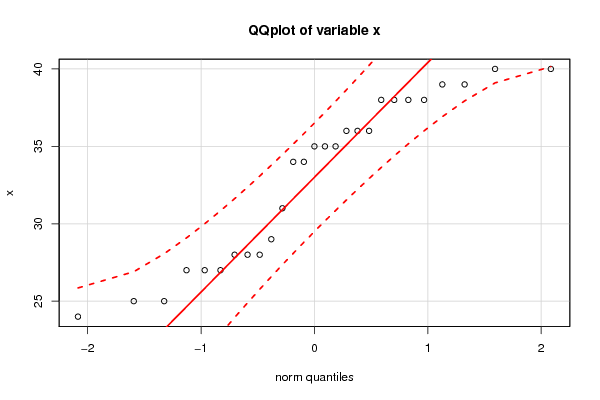
| Normality Tests |
> jarque.x Jarque-Bera Normality Test data: x JB = 2.5805, p-value = 0.2752 alternative hypothesis: greater |
> jarque.y Jarque-Bera Normality Test data: y JB = 9.7502, p-value = 0.007634 alternative hypothesis: greater |
> ad.x Anderson-Darling normality test data: x A = 1.057, p-value = 0.007412 |
> ad.y Anderson-Darling normality test data: y A = 0.83414, p-value = 0.02728 |