| Pearson Product Moment Correlation - Ungrouped Data | ||
| Statistic | Variable X | Variable Y |
| Mean | 17.72 | 15.2 |
| Biased Variance | 10.6016 | 10.16 |
| Biased Standard Deviation | 3.256009827995 | 3.18747549010185 |
| Covariance | 4.30833333333333 | |
| Correlation | 0.39851802469059 | |
| Determination | 0.158816616003289 | |
| T-Test | 2.08385043186529 | |
| p-value (2 sided) | 0.0484738898535133 | |
| p-value (1 sided) | 0.0242369449267566 | |
| 95% CI of Correlation | [0.0040201690153908, 0.685677492915158] | |
| Degrees of Freedom | 23 | |
| Number of Observations | 25 | |
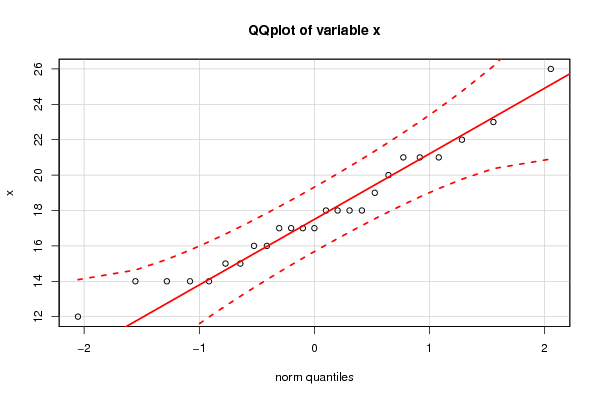
| Normality Tests |
> jarque.x Jarque-Bera Normality Test data: x JB = 1.2364, p-value = 0.5389 alternative hypothesis: greater |
> jarque.y Jarque-Bera Normality Test data: y JB = 2.2411, p-value = 0.3261 alternative hypothesis: greater |
> ad.x Anderson-Darling normality test data: x A = 0.36836, p-value = 0.4019 |
> ad.y Anderson-Darling normality test data: y A = 0.87432, p-value = 0.02127 |