| Multiple Linear Regression - Estimated Regression Equation |
| NUMERACYTOT[t] = + 19.2686 + 1.82359gender[t] -0.604147group[t] + e[t] |
| Multiple Linear Regression - Ordinary Least Squares | |||||
| Variable | Parameter | S.D. | T-STAT H0: parameter = 0 | 2-tail p-value | 1-tail p-value |
| (Intercept) | +19.27 | 0.539 | +3.5750e+01 | 2.222e-105 | 1.111e-105 |
| gender | +1.824 | 0.6143 | +2.9690e+00 | 0.003256 | 0.001628 |
| group | -0.6041 | 0.6087 | -9.9250e-01 | 0.3218 | 0.1609 |
| Multiple Linear Regression - Regression Statistics | |
| Multiple R | 0.1812 |
| R-squared | 0.03284 |
| Adjusted R-squared | 0.0258 |
| F-TEST (value) | 4.668 |
| F-TEST (DF numerator) | 2 |
| F-TEST (DF denominator) | 275 |
| p-value | 0.01015 |
| Multiple Linear Regression - Residual Statistics | |
| Residual Standard Deviation | 5.052 |
| Sum Squared Residuals | 7019 |
| Menu of Residual Diagnostics | |
| Description | Link |
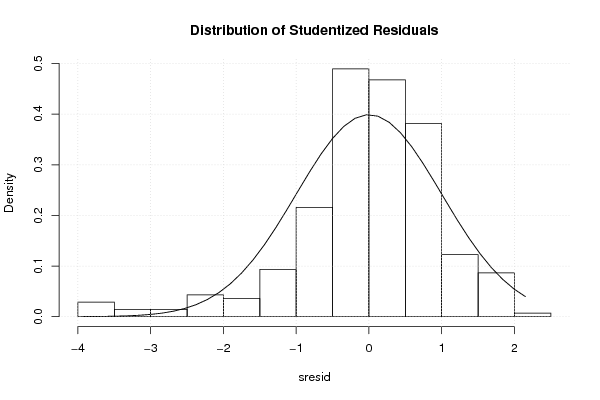
| Histogram | Compute |
| Central Tendency | Compute |
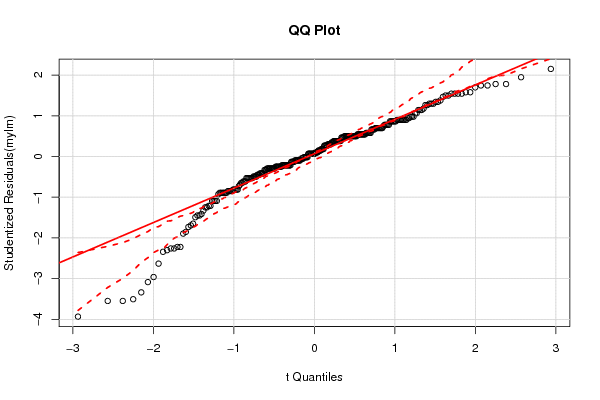
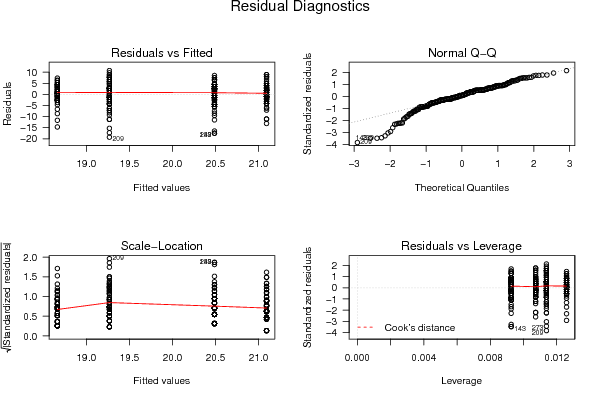
| QQ Plot | Compute |
| Kernel Density Plot | Compute |
| Skewness/Kurtosis Test | Compute |
| Skewness-Kurtosis Plot | Compute |
| Harrell-Davis Plot | Compute |
| Bootstrap Plot -- Central Tendency | Compute |
| Blocked Bootstrap Plot -- Central Tendency | Compute |
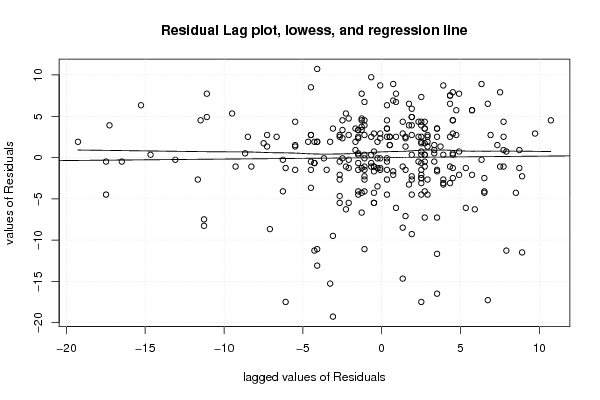
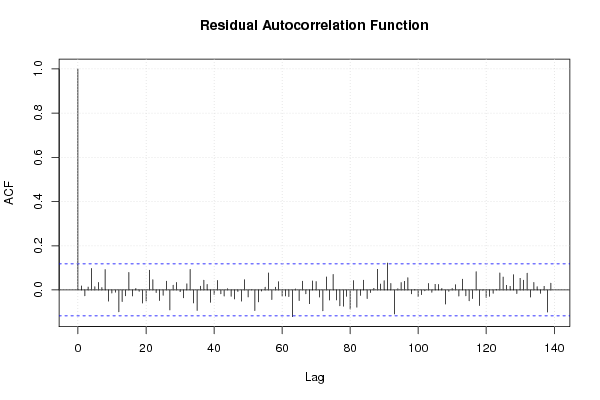
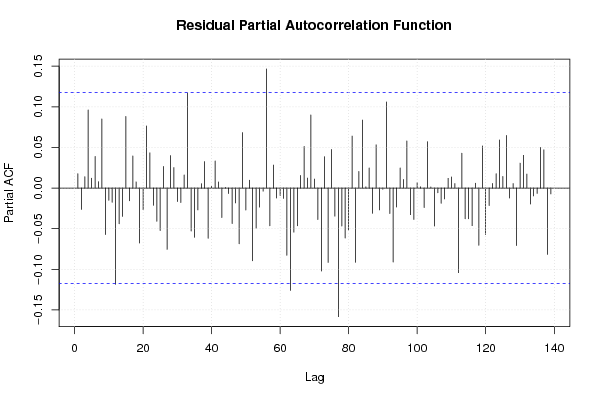
| (Partial) Autocorrelation Plot | Compute |
| Spectral Analysis | Compute |
| Tukey lambda PPCC Plot | Compute |
| Box-Cox Normality Plot | Compute |
| Summary Statistics | Compute |
| Ramsey RESET F-Test for powers (2 and 3) of fitted values |
> reset_test_fitted RESET test data: mylm RESET = 0.17872, df1 = 2, df2 = 273, p-value = 0.8364 |
| Ramsey RESET F-Test for powers (2 and 3) of regressors |
> reset_test_regressors RESET test data: mylm RESET = 0, df1 = 4, df2 = 271, p-value = 1 |
| Ramsey RESET F-Test for powers (2 and 3) of principal components |
> reset_test_principal_components RESET test data: mylm RESET = 0.17872, df1 = 2, df2 = 273, p-value = 0.8364 |
| Variance Inflation Factors (Multicollinearity) |
> vif gender group 1.008434 1.008434 |