| Multiple Linear Regression - Estimated Regression Equation |
| LFM[t] = + 30794.4 + 21.4033Calculation[t] -5.21851Graphical_Interpretation[t] + 1.5486Proportionality_and_Ratio[t] + 1.17462Probability_and_Sampling[t] -4.26801Estimation[t] -15.2643year[t] + 40.8551group[t] -8.21333gender[t] + e[t] |
| Warning: you did not specify the column number of the endogenous series! The first column was selected by default. |
| Multiple Linear Regression - Ordinary Least Squares | |||||
| Variable | Parameter | S.D. | T-STAT H0: parameter = 0 | 2-tail p-value | 1-tail p-value |
| (Intercept) | +3.079e+04 | 8378 | +3.6760e+00 | 0.0002863 | 0.0001432 |
| Calculation | +21.4 | 13.34 | +1.6040e+00 | 0.1098 | 0.0549 |
| Graphical_Interpretation | -5.218 | 9.76 | -5.3470e-01 | 0.5933 | 0.2967 |
| Proportionality_and_Ratio | +1.549 | 6.271 | +2.4690e-01 | 0.8051 | 0.4026 |
| Probability_and_Sampling | +1.175 | 5.911 | +1.9870e-01 | 0.8426 | 0.4213 |
| Estimation | -4.268 | 5.576 | -7.6540e-01 | 0.4447 | 0.2223 |
| year | -15.26 | 4.165 | -3.6650e+00 | 0.0002979 | 0.0001489 |
| group | +40.85 | 4.05 | +1.0090e+01 | 1.662e-20 | 8.311e-21 |
| gender | -8.213 | 4.29 | -1.9150e+00 | 0.05661 | 0.0283 |
| Multiple Linear Regression - Regression Statistics | |
| Multiple R | 0.5647 |
| R-squared | 0.3189 |
| Adjusted R-squared | 0.2986 |
| F-TEST (value) | 15.74 |
| F-TEST (DF numerator) | 8 |
| F-TEST (DF denominator) | 269 |
| p-value | 0 |
| Multiple Linear Regression - Residual Statistics | |
| Residual Standard Deviation | 33.36 |
| Sum Squared Residuals | 2.994e+05 |
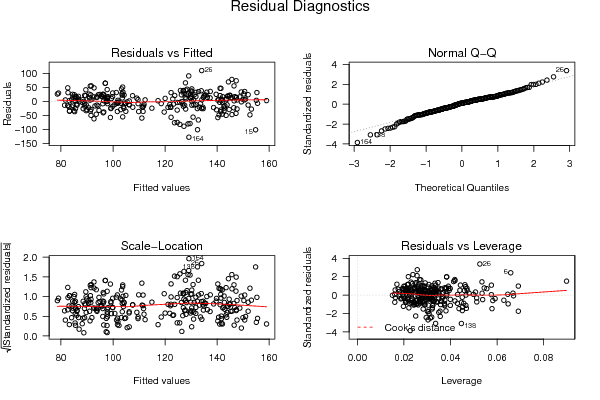
| Menu of Residual Diagnostics | |
| Description | Link |
| Histogram | Compute |
| Central Tendency | Compute |
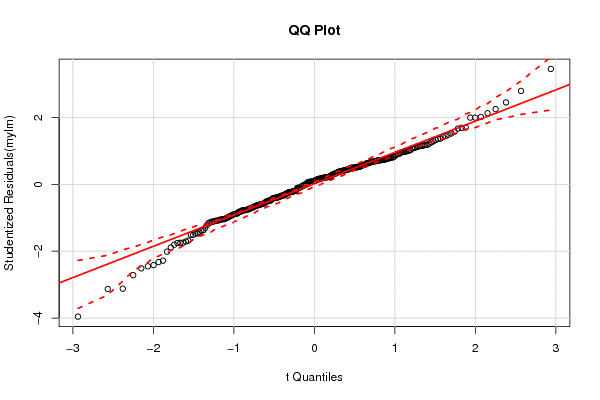
| QQ Plot | Compute |
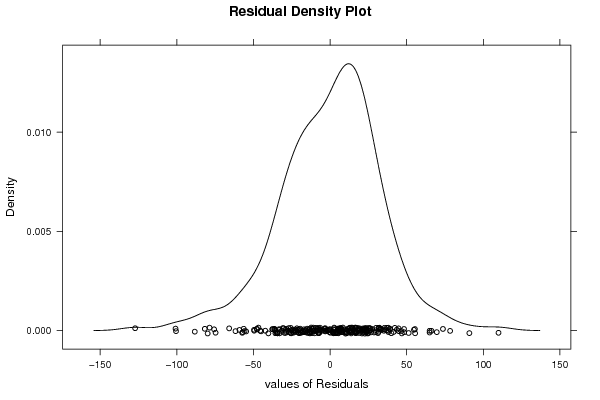
| Kernel Density Plot | Compute |
| Skewness/Kurtosis Test | Compute |
| Skewness-Kurtosis Plot | Compute |
| Harrell-Davis Plot | Compute |
| Bootstrap Plot -- Central Tendency | Compute |
| Blocked Bootstrap Plot -- Central Tendency | Compute |
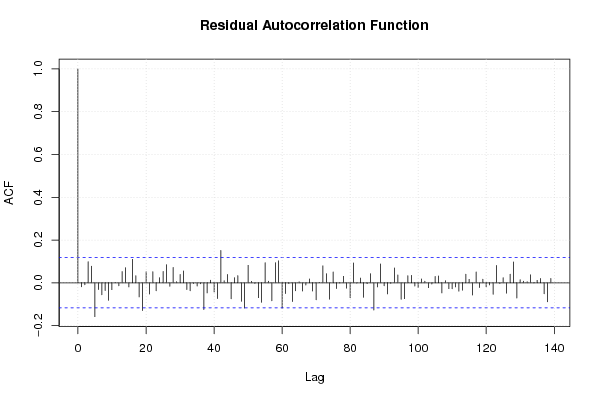
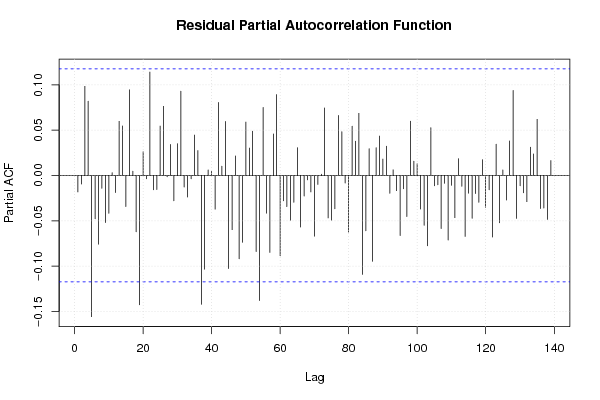
| (Partial) Autocorrelation Plot | Compute |
| Spectral Analysis | Compute |
| Tukey lambda PPCC Plot | Compute |
| Box-Cox Normality Plot | Compute |
| Summary Statistics | Compute |
| Ramsey RESET F-Test for powers (2 and 3) of fitted values |
> reset_test_fitted RESET test data: mylm RESET = 0.70344, df1 = 2, df2 = 267, p-value = 0.4958 |
| Ramsey RESET F-Test for powers (2 and 3) of regressors |
> reset_test_regressors RESET test data: mylm RESET = 0.8814, df1 = 16, df2 = 253, p-value = 0.5913 |
| Ramsey RESET F-Test for powers (2 and 3) of principal components |
> reset_test_principal_components RESET test data: mylm RESET = 0.44868, df1 = 2, df2 = 267, p-value = 0.6389 |
| Variance Inflation Factors (Multicollinearity) |
> vif
              Calculation  Graphical_Interpretation Proportionality_and_Ratio
                 1.439191                  1.378246                  1.221422
 Probability_and_Sampling                Estimation                      year
                 1.188409                  1.170193                  1.042329
                    group                    gender
                 1.023757                  1.127755
|