| Multiple Linear Regression - Estimated Regression Equation |
| LFM[t] = + 28132.6 + 17.6162Calculation[t] + 17.4802Algebraic_Reasoning[t] -2.98619Graphical_Interpretation[t] -0.763909Proportionality_and_Ratio[t] + 0.779358Probability_and_Sampling[t] -6.93833Estimation[t] -13.9483year[t] + 39.6444group[t] -8.70156gender[t] -0.0677119`LFM(t-1)`[t] -0.00666002`LFM(t-2)`[t] + 0.0607043`LFM(t-3)`[t] + 0.116849`LFM(t-4)`[t] -0.00113915`LFM(t-1s)`[t] + e[t] |
| Multiple Linear Regression - Ordinary Least Squares | |||||
| Variable | Parameter | S.D. | T-STAT H0: parameter = 0 | 2-tail p-value | 1-tail p-value |
| (Intercept) | +2.813e+04 | 9427 | +2.9840e+00 | 0.003127 | 0.001564 |
| Calculation | +17.62 | 14.01 | +1.2570e+00 | 0.2098 | 0.1049 |
| Algebraic_Reasoning | +17.48 | 13.18 | +1.3270e+00 | 0.1858 | 0.09292 |
| Graphical_Interpretation | -2.986 | 11.07 | -2.6970e-01 | 0.7876 | 0.3938 |
| Proportionality_and_Ratio | -0.7639 | 6.533 | -1.1690e-01 | 0.907 | 0.4535 |
| Probability_and_Sampling | +0.7794 | 6.191 | +1.2590e-01 | 0.8999 | 0.45 |
| Estimation | -6.938 | 5.798 | -1.1970e+00 | 0.2326 | 0.1163 |
| year | -13.95 | 4.684 | -2.9780e+00 | 0.003191 | 0.001595 |
| group | +39.64 | 4.612 | +8.5960e+00 | 9.596e-16 | 4.798e-16 |
| gender | -8.702 | 4.491 | -1.9370e+00 | 0.05383 | 0.02692 |
| `LFM(t-1)` | -0.06771 | 0.05536 | -1.2230e+00 | 0.2225 | 0.1112 |
| `LFM(t-2)` | -0.00666 | 0.05481 | -1.2150e-01 | 0.9034 | 0.4517 |
| `LFM(t-3)` | +0.0607 | 0.05592 | +1.0860e+00 | 0.2787 | 0.1394 |
| `LFM(t-4)` | +0.1168 | 0.05634 | +2.0740e+00 | 0.03912 | 0.01956 |
| `LFM(t-1s)` | -0.001139 | 0.05318 | -2.1420e-02 | 0.9829 | 0.4915 |
| Multiple Linear Regression - Regression Statistics | |
| Multiple R | 0.5785 |
| R-squared | 0.3347 |
| Adjusted R-squared | 0.297 |
| F-TEST (value) | 8.876 |
| F-TEST (DF numerator) | 14 |
| F-TEST (DF denominator) | 247 |
| p-value | 1.332e-15 |
| Multiple Linear Regression - Residual Statistics | |
| Residual Standard Deviation | 33 |
| Sum Squared Residuals | 2.689e+05 |
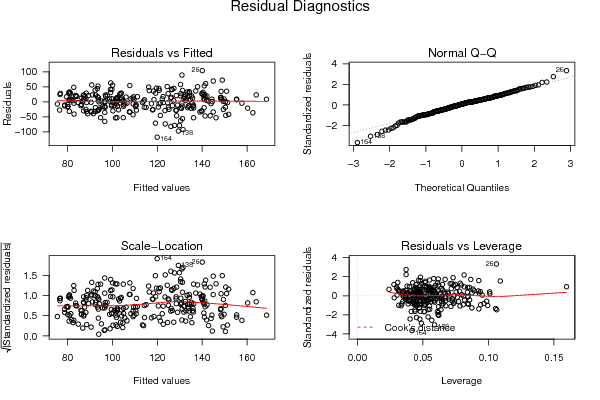
| Menu of Residual Diagnostics | |
| Description | Link |
| Histogram | Compute |
| Central Tendency | Compute |
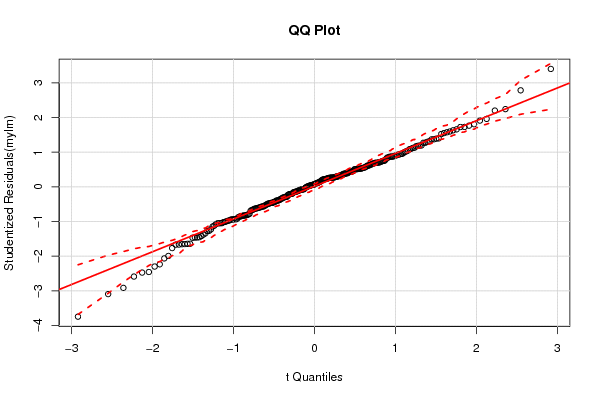
| QQ Plot | Compute |
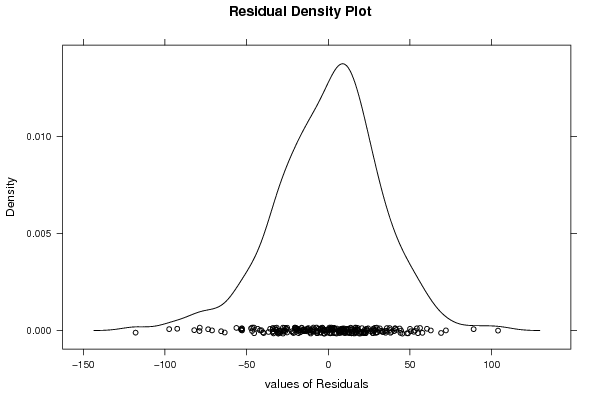
| Kernel Density Plot | Compute |
| Skewness/Kurtosis Test | Compute |
| Skewness-Kurtosis Plot | Compute |
| Harrell-Davis Plot | Compute |
| Bootstrap Plot -- Central Tendency | Compute |
| Blocked Bootstrap Plot -- Central Tendency | Compute |
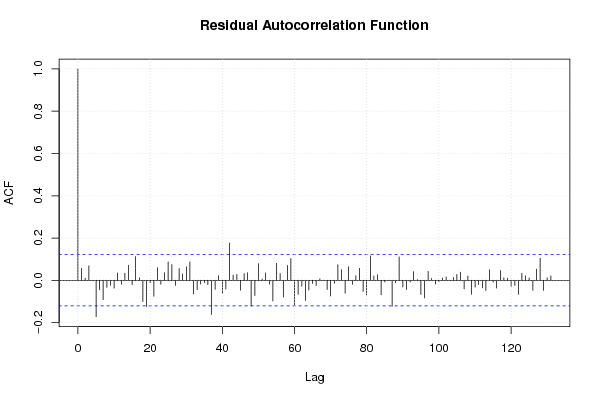
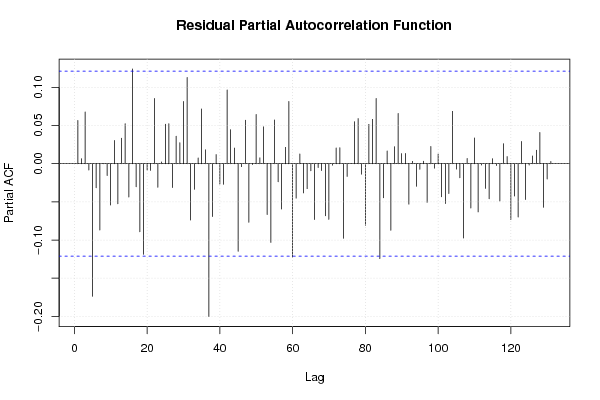
| (Partial) Autocorrelation Plot | Compute |
| Spectral Analysis | Compute |
| Tukey lambda PPCC Plot | Compute |
| Box-Cox Normality Plot | Compute |
| Summary Statistics | Compute |
| Ramsey RESET F-Test for powers (2 and 3) of fitted values |
> reset_test_fitted RESET test data: mylm RESET = 0.72823, df1 = 2, df2 = 245, p-value = 0.4838 |
| Ramsey RESET F-Test for powers (2 and 3) of regressors |
> reset_test_regressors RESET test data: mylm RESET = 0.83284, df1 = 28, df2 = 219, p-value = 0.7102 |
| Ramsey RESET F-Test for powers (2 and 3) of principal components |
> reset_test_principal_components RESET test data: mylm RESET = 3.3476, df1 = 2, df2 = 245, p-value = 0.03678 |
| Variance Inflation Factors (Multicollinearity) |
> vif
              Calculation       Algebraic_Reasoning  Graphical_Interpretation
                 1.589038                  1.596461                  1.624935
Proportionality_and_Ratio  Probability_and_Sampling                Estimation
                 1.279197                  1.266847                  1.214879
                     year                     group                    gender
                 1.225663                  1.278552                  1.193148
               `LFM(t-1)`                `LFM(t-2)`                `LFM(t-3)`
                 1.119827                  1.107500                  1.163685
               `LFM(t-4)`               `LFM(t-1s)`
                 1.181108                  1.090649
|