| Multiple Linear Regression - Estimated Regression Equation |
| LFM[t] = + 24879.9 + 20.2177Calculation[t] + 15.0106Algebraic_Reasoning[t] -6.96853Graphical_Interpretation[t] + 0.560038Proportionality_and_Ratio[t] -1.37891Probability_and_Sampling[t] -5.64846Estimation[t] -12.3256year[t] + 41.3052group[t] -7.69734gender[t] + 0.954521M1[t] + 2.91651M2[t] -3.35126M3[t] -2.08744M4[t] + 6.48511M5[t] + 3.3111M6[t] + 6.24443M7[t] -1.78651M8[t] + 12.8472M9[t] + 3.1895M10[t] + 7.18467M11[t] -0.0200312t + e[t] |
| Multiple Linear Regression - Ordinary Least Squares | |||||
| Variable | Parameter | S.D. | T-STAT H0: parameter = 0 | 2-tail p-value | 1-tail p-value |
| (Intercept) | +2.488e+04 | 1.737e+04 | +1.4320e+00 | 0.1533 | 0.07663 |
| Calculation | +20.22 | 14.13 | +1.4300e+00 | 0.1538 | 0.0769 |
| Algebraic_Reasoning | +15.01 | 13.33 | +1.1260e+00 | 0.2612 | 0.1306 |
| Graphical_Interpretation | -6.968 | 10.42 | -6.6890e-01 | 0.5042 | 0.2521 |
| Proportionality_and_Ratio | +0.56 | 6.549 | +8.5510e-02 | 0.9319 | 0.466 |
| Probability_and_Sampling | -1.379 | 6.247 | -2.2070e-01 | 0.8255 | 0.4127 |
| Estimation | -5.649 | 5.754 | -9.8170e-01 | 0.3272 | 0.1636 |
| year | -12.33 | 8.639 | -1.4270e+00 | 0.1549 | 0.07744 |
| group | +41.3 | 4.721 | +8.7490e+00 | 2.939e-16 | 1.47e-16 |
| gender | -7.697 | 4.465 | -1.7240e+00 | 0.08596 | 0.04298 |
| M1 | +0.9545 | 9.997 | +9.5480e-02 | 0.924 | 0.462 |
| M2 | +2.917 | 9.94 | +2.9340e-01 | 0.7694 | 0.3847 |
| M3 | -3.351 | 10.05 | -3.3330e-01 | 0.7391 | 0.3696 |
| M4 | -2.087 | 10.07 | -2.0720e-01 | 0.836 | 0.418 |
| M5 | +6.485 | 10.24 | +6.3340e-01 | 0.5271 | 0.2635 |
| M6 | +3.311 | 9.995 | +3.3130e-01 | 0.7407 | 0.3703 |
| M7 | +6.244 | 10.05 | +6.2110e-01 | 0.5351 | 0.2675 |
| M8 | -1.786 | 10.11 | -1.7680e-01 | 0.8598 | 0.4299 |
| M9 | +12.85 | 10.1 | +1.2720e+00 | 0.2045 | 0.1023 |
| M10 | +3.189 | 10.09 | +3.1620e-01 | 0.7521 | 0.376 |
| M11 | +7.185 | 10.16 | +7.0740e-01 | 0.48 | 0.24 |
| t | -0.02003 | 0.05424 | -3.6930e-01 | 0.7122 | 0.3561 |
| Multiple Linear Regression - Regression Statistics | |
| Multiple R | 0.5799 |
| R-squared | 0.3363 |
| Adjusted R-squared | 0.2818 |
| F-TEST (value) | 6.176 |
| F-TEST (DF numerator) | 21 |
| F-TEST (DF denominator) | 256 |
| p-value | 8.205e-14 |
| Multiple Linear Regression - Residual Statistics | |
| Residual Standard Deviation | 33.76 |
| Sum Squared Residuals | 2.917e+05 |
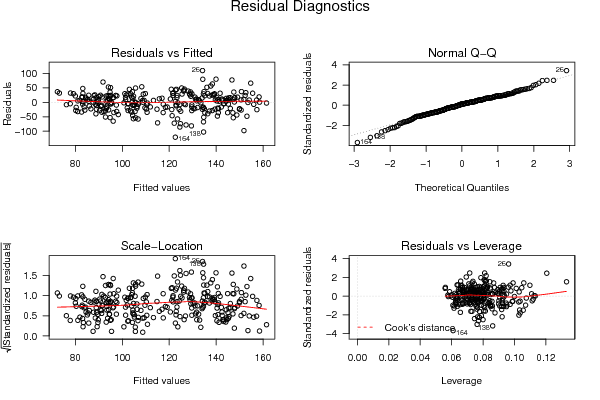
| Menu of Residual Diagnostics | |
| Description | Link |
| Histogram | Compute |
| Central Tendency | Compute |
| QQ Plot | Compute |
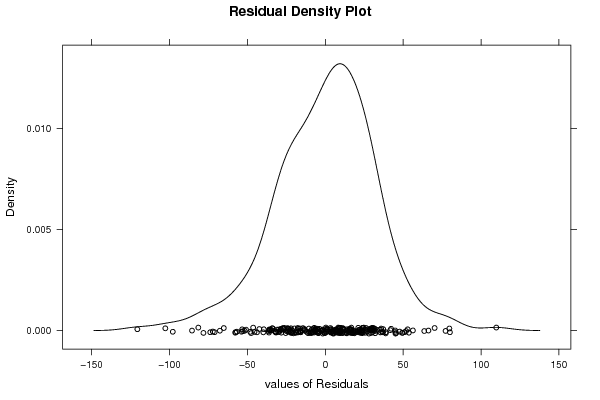
| Kernel Density Plot | Compute |
| Skewness/Kurtosis Test | Compute |
| Skewness-Kurtosis Plot | Compute |
| Harrell-Davis Plot | Compute |
| Bootstrap Plot -- Central Tendency | Compute |
| Blocked Bootstrap Plot -- Central Tendency | Compute |
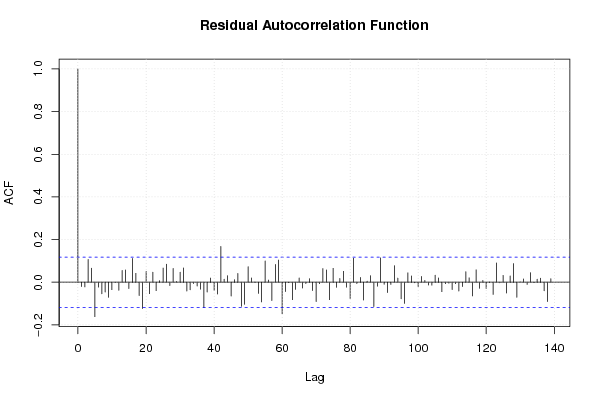
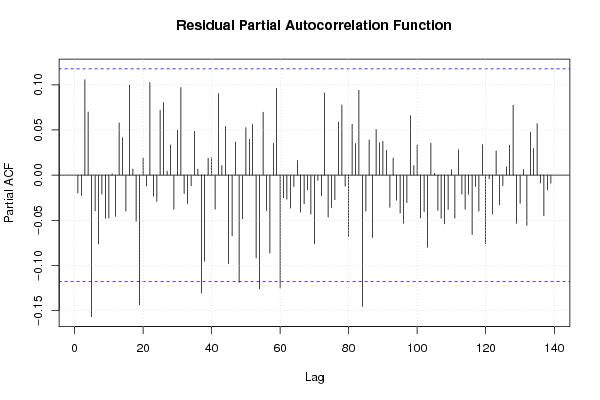
| (Partial) Autocorrelation Plot | Compute |
| Spectral Analysis | Compute |
| Tukey lambda PPCC Plot | Compute |
| Box-Cox Normality Plot | Compute |
| Summary Statistics | Compute |
| Ramsey RESET F-Test for powers (2 and 3) of fitted values |
> reset_test_fitted RESET test data: mylm RESET = 1.7844, df1 = 2, df2 = 254, p-value = 0.17 |
| Ramsey RESET F-Test for powers (2 and 3) of regressors |
> reset_test_regressors RESET test data: mylm RESET = 0.40395, df1 = 42, df2 = 214, p-value = 0.9996 |
| Ramsey RESET F-Test for powers (2 and 3) of principal components |
> reset_test_principal_components RESET test data: mylm RESET = 0.95287, df1 = 2, df2 = 254, p-value = 0.387 |
| Variance Inflation Factors (Multicollinearity) |
> vif
              Calculation       Algebraic_Reasoning  Graphical_Interpretation
                 1.577645                  1.607779                  1.533477
Proportionality_and_Ratio  Probability_and_Sampling                Estimation
                 1.300979                  1.296287                  1.217018
                     year                     group                    gender
                 4.380023                  1.358677                  1.193408
                       M1                        M2                        M3
                 1.922978                  1.901033                  1.871115
                       M4                        M5                        M6
                 1.878633                  1.940996                  1.849343
                       M7                        M8                        M9
                 1.871060                  1.890556                  1.888720
                      M10                       M11                         t
                 1.883348                  1.909858                  4.622565
|