Free Statistics

of Irreproducible Research!

Author's title

Author*The author of this computation has been verified*
R Software Modulerwasp_multipleregression.wasp
Title produced by softwareMultiple Regression
Date of computationWed, 24 Jan 2018 10:37:59 +0100
Cite this page as followsStatistical Computations at FreeStatistics.org, Office for Research Development and Education, URL https://freestatistics.org/blog/index.php?v=date/2018/Jan/24/t15167870241hyx2fqssl50059.htm/, Retrieved Mon, 06 May 2024 01:36:16 +0200
Statistical Computations at FreeStatistics.org, Office for Research Development and Education, URL https://freestatistics.org/blog/index.php?pk=, Retrieved Mon, 06 May 2024 01:36:16 +0200
QR Codes:

Original text written by user:
IsPrivate?No (this computation is public)
User-defined keywords
Estimated Impact0
Dataseries X:
149 1 0.5 0.67 0.67 0 0.5 2011 1 0
139 0.89 0.5 0.83 0.33 0.5 1 2011 1 1
148 0.89 0.4 1 0.67 0 1 2011 1 0
158 0.89 0.5 0.83 0 0 0 2011 1 1
128 0.89 0.7 0.67 0 1 1 2011 1 1
224 0.78 0.3 0 0 0.5 0.5 2011 1 1
159 0.89 0.4 0.83 0.67 0.5 0 2011 1 0
105 1 0.4 0.5 0.67 1 1 2011 1 1
159 0.89 0.7 0.83 0 0.5 0 2011 1 1
167 0.78 0.6 0.33 0.67 0.5 0.5 2011 1 1
165 1 0.6 0.5 1 0 0.5 2011 1 1
159 0.78 0.2 0.67 0 0.5 0.5 2011 1 1
119 0.89 0.4 1 0 0.5 0.5 2011 1 1
176 0.89 0.4 0.5 0.67 0 1 2011 1 0
54 0.89 0.5 0.67 0.33 0 0 2011 1 0
91 0.89 0.3 0.17 0.67 0 0.5 2011 0 0
163 0.89 0.4 0.83 0.33 0.5 0.5 2011 1 1
124 0.67 0.7 0.67 0.33 0.5 1 2011 1 0
137 1 0.5 0.67 0.33 0 1 2011 0 1
121 0.78 0.2 0.67 0 0 1 2011 1 0
153 0.78 0.3 0.5 0.67 0 0.5 2011 1 1
148 0.89 0.6 1 0.33 0 1 2011 1 1
221 0.78 0.6 0.83 0.33 0 1 2011 1 0
188 0.89 0.2 0.83 0.33 0 1 2011 1 1
149 0.89 0.7 1 0.67 1 0 2011 1 1
244 0.33 0.2 0.67 0 0 0 2011 1 1
148 1 1 1 0.33 1 1 2011 0 1
92 0.89 0.4 0.83 0.67 0 0.5 2011 0 0
150 0.89 0.4 1 1 0 1 2011 1 1
153 0.67 0.2 0.83 0.67 0 0.5 2011 1 0
94 0.56 0.4 0.67 0.33 0 1 2011 1 0
156 0.89 0.4 0.67 0 0.5 1 2011 1 0
132 0.89 0.7 1 0.67 0.5 0.5 2011 1 1
161 1 0.2 0.67 0.67 0 0.5 2011 1 1
105 0.78 0.6 1 1 0 0.5 2011 1 1
97 0.78 0.3 1 1 0.5 0.5 2011 1 1
151 0.33 0.3 0.5 0.33 0 0 2011 1 0
131 0.78 0.2 0.67 0 0.5 0 2011 0 1
166 0.89 0.5 0.83 0.67 0.5 0.5 2011 1 1
157 0.89 0.7 1 0.67 0.5 1 2011 1 0
111 0.78 0.6 1 0.67 0.5 0.5 2011 1 1
145 0.89 0.4 1 0.67 0.5 1 2011 1 1
162 0.89 0.6 1 0.33 0.5 1 2011 1 1
163 1 0.4 1 1 0 1 2011 1 1
59 0.67 0.3 0.83 0.67 0 1 2011 0 1
187 1 0.5 0.83 0.67 0.5 0.5 2011 1 0
109 0.89 0.2 0.5 0 0 1 2011 1 1
90 0.89 0.3 0.83 0 0.5 1 2011 0 1
105 0.89 0.5 0.17 0 0 1 2011 1 0
83 0.78 0.7 0.83 1 0.5 1 2011 0 1
116 0.89 0.4 1 0.67 1 0.5 2011 0 1
42 0.78 0.3 1 0 0 0.5 2011 0 1
148 0.78 0.2 0.67 0.67 1 1 2011 1 1
155 1 0.5 1 0 0 0.5 2011 0 1
125 0.78 0.4 1 0 0.5 0 2011 1 1
116 1 0.6 1 0.67 1 1 2011 1 1
128 0.78 0.4 0.83 1 0 1 2011 0 0
138 0.67 0.4 0.33 0 0 0.5 2011 1 1
49 0.33 0.2 0.33 0.33 0 0 2011 0 0
96 1 0.9 1 0.67 0.5 1 2011 0 1
164 1 0.8 1 0.67 1 0.5 2011 1 1
162 0.78 0.8 0.83 0 0.5 1 2011 1 0
99 0.67 0.3 1 1 0.5 1 2011 1 0
202 1 0.2 0.83 0.67 0 0.5 2011 1 1
186 0.89 0.4 0.67 0 0.5 1 2011 1 0
66 0.89 0.2 0.83 1 0 1 2011 0 1
183 0.78 0.2 0.67 0.67 0.5 1 2011 1 0
214 1 0.1 0.83 0.67 0 1 2011 1 1
188 0.56 0.4 0.67 1 0.5 0 2011 1 1
104 0.67 0.5 1 0 0.5 0.5 2011 0 0
177 0.89 0.8 0.83 0.33 0.5 1 2011 1 0
126 0.89 0.4 0.67 0.67 0 0.5 2011 1 0
76 0.89 0.6 0.83 0.33 0.5 0.5 2011 0 0
99 0.89 0.5 0.83 0.67 0.5 1 2011 0 1
139 0.78 0.3 0.67 0 0 0 2011 1 0
162 1 0.4 0.33 0 0.5 0 2011 1 0
108 1 0.6 0.83 0.67 0.5 0.5 2011 0 1
159 0.89 0.4 1 0.33 0 0.5 2011 1 0
74 0.44 0.3 0.83 0 0 0 2011 0 0
110 0.78 0.8 0.83 0 1 1 2011 1 1
96 0.89 0.6 0.5 0.33 1 1 2011 0 0
116 0.67 0.3 0.5 0 0 0 2011 0 0
87 0.78 0.5 0.83 0.67 0.5 1 2011 0 0
97 0.78 0.4 1 0.33 0 1 2011 0 1
127 0.33 0.3 0.33 0.67 0 0 2011 0 0
106 0.89 0.7 1 0.33 0 0.5 2011 0 1
80 0.89 0.2 0.67 0.33 0.5 0.5 2011 0 1
74 0.89 0.4 0.83 1 0 1 2011 0 0
91 0.89 0.6 1 0.67 0.5 0.5 2011 0 0
133 0.56 0.6 0.83 0 0 1 2011 0 0
74 0.67 0.6 0.83 0.67 0.5 0.5 2011 0 1
114 0.67 0.4 1 0.33 0.5 1 2011 0 1
140 0.78 0.6 0.83 0 0 1 2011 0 1
95 0.78 0.5 1 0.33 0.5 1 2011 0 0
98 0.78 0.5 0.83 0 0 1 2011 0 1
121 0.89 0.6 0.67 0 0 1 2011 0 0
126 1 0.8 0.83 0.33 0.5 1 2011 0 1
98 0.89 0.5 0.83 0.67 1 0.5 2011 0 1
95 0.89 0.6 0.83 0.67 0.5 1 2011 0 1
110 0.78 0.4 0.83 0.67 0.5 1 2011 0 1
70 1 0.3 0.67 0.67 0.5 1 2011 0 1
102 0.78 0.3 0.83 1 0 0.5 2011 0 0
86 0.67 0.2 0 0 0 0 2011 0 1
130 0.78 0.4 0.83 0 0 0.5 2011 0 1
96 0.89 0.5 1 0 0 0.5 2011 0 1
102 0.67 0.3 0.17 0 0.5 0 2011 0 0
100 0.22 0.4 0.17 0 0.5 0 2011 0 0
94 0.44 0.5 0.5 1 0 0 2011 0 0
52 0.89 0.3 0.5 0.67 0 1 2011 0 0
98 0.67 0.5 1 0 0 0.5 2011 0 0
118 0.89 0.4 0.67 0.67 0 0.5 2011 0 0
99 0.67 0.4 0.83 0.67 0 1 2011 0 1
48 0.78 0.6 1 0 1 1 2012 1 1
50 0.78 0.3 1 0.67 1 1 2012 1 1
150 0.78 0.4 1 0.33 1 0.5 2012 1 1
154 1 0.3 1 1 1 1 2012 1 1
109 0.78 1 1 1 1 1 2012 0 0
68 0.67 0.4 1 0 0 0.5 2012 0 1
194 0.89 0.8 0.83 1 0.5 1 2012 1 1
158 0.89 0.3 1 0.67 1 1 2012 1 0
159 1 0.5 0.83 0.67 0 1 2012 1 1
67 0.78 0.4 1 0 0 0.5 2012 1 0
147 0.67 0.3 0.83 0.67 0 1 2012 1 0
39 0.89 0.5 0.83 1 0 1 2012 1 1
100 0.67 0.3 1 0.67 0 1 2012 1 1
111 0.67 0.3 0.67 0 0 1 2012 1 1
138 1 0.4 0.83 0 0 1 2012 1 1
101 0.67 0.3 1 0 0 0.5 2012 1 1
131 1 0.6 1 0.33 0.5 0.5 2012 0 1
101 0.89 0.6 0.83 0.67 1 1 2012 1 1
114 0.89 0.4 1 1 1 1 2012 1 1
165 1 0.4 1 0 0 0 2012 1 0
114 0.67 0.4 1 0.67 0 0.5 2012 1 1
111 0.44 0.3 0.67 0.67 0.5 1 2012 1 1
75 0.89 0.2 1 0.33 1 0 2012 1 1
82 0.56 0.5 0.83 0.67 0 1 2012 1 1
121 0.78 0.4 1 0.67 1 1 2012 1 1
32 1 0.4 1 0.67 0 0 2012 1 1
150 1 0.4 0.83 0.67 0 1 2012 1 0
117 0.89 0.3 0.67 0.67 0.5 0.5 2012 1 1
71 0.67 0.4 0.83 0.67 1 0.5 2012 0 1
165 0.89 0.2 1 0.33 0.5 1 2012 1 1
154 0.33 0 0 0 0 0 2012 1 1
126 0.89 0.4 1 0.67 0.5 1 2012 1 1
149 0.78 0.6 1 0 1 1 2012 1 0
145 1 0.4 0.67 0.67 0 0.5 2012 1 0
120 0.44 0.4 1 0 0 0.5 2012 1 1
109 0.67 0.4 0.83 0 0.5 0 2012 1 0
132 0.33 0.2 0.17 0 0.5 0 2012 1 0
172 0.89 0.4 0.83 1 1 1 2012 1 1
169 0.89 0.3 0.83 0 0 0.5 2012 1 0
114 1 0.6 0.83 0.67 1 0 2012 1 1
156 0.89 0.6 0.83 1 0 1 2012 1 1
172 0.89 0.4 0.83 0 0 1 2012 1 0
68 1 0.5 1 0.67 1 0.5 2012 0 1
89 0.89 0.4 0.83 0 0.5 1 2012 0 1
167 1 0.6 1 1 1 1 2012 1 1
113 0.78 0.6 0.83 0.67 0.5 1 2012 1 0
115 0.78 0.9 1 0.67 0.5 1 2012 0 0
78 0.67 0.4 0.83 0.67 0.5 0 2012 0 0
118 0.89 0.8 1 1 0.5 1 2012 0 0
87 0.67 0.5 0.83 1 0 1 2012 0 1
173 0.78 0.4 0.83 1 0 0 2012 1 0
2 0.89 0.4 1 0.67 1 0.5 2012 1 1
162 0.89 0.7 1 1 1 0.5 2012 0 0
49 0.78 0.4 1 0.33 1 1 2012 0 1
122 1 0.8 1 0.67 0.5 1 2012 0 0
96 1 0.4 1 1 1 0.5 2012 0 1
100 1 0.3 1 0.67 0 0.5 2012 0 0
82 0.67 0.5 1 0.67 0.5 1 2012 0 0
100 0.89 0.8 1 0.67 1 1 2012 0 1
115 1 0.4 0.83 0.33 0 0.5 2012 0 0
141 1 1 1 1 0.5 0 2012 0 1
165 0.89 0.5 1 0.67 1 1 2012 1 1
165 0.89 0.5 1 0.67 1 1 2012 1 1
110 0.89 0.3 1 0.33 0 1 2012 0 1
118 0.89 0.3 0.83 0.33 0.5 1 2012 1 1
158 0.89 0.3 0.5 0 0 1 2012 1 0
146 1 0.4 0.67 0.33 0.5 0.5 2012 0 1
49 0.67 0.5 1 0.33 0 1 2012 1 0
90 1 0.5 0.67 0.67 0.5 1 2012 0 0
121 0.89 0.4 1 0 0 0 2012 0 0
155 0.89 0.7 1 1 0.5 0 2012 1 1
104 0.89 0.5 0.5 0.33 0 0.5 2012 0 0
147 0.89 0.4 0.67 0.33 1 0 2012 0 1
110 1 0.7 0.67 1 0 1 2012 0 0
108 1 0.7 0.67 1 0 1 2012 0 0
113 1 0.7 0.67 1 0 1 2012 0 0
115 0.89 0.7 0.67 1 0 1 2012 0 0
61 0.89 0.7 0.67 0 0 0 2012 0 1
60 0.89 0.7 1 0.67 0.5 1 2012 0 1
109 0.33 0.1 0.67 0.33 0.5 0 2012 0 1
68 0.67 0.2 0.67 0.67 0.5 1 2012 0 1
111 0.56 0.3 0.33 0.33 0 1 2012 0 0
77 0.44 0.6 0.83 0.33 0 0.5 2012 0 0
73 1 0.8 1 1 1 1 2012 0 1
151 0.89 0.8 1 0.33 0.5 0.5 2012 1 0
89 0.33 0 0.17 0 0 0 2012 0 0
78 0.67 0.3 0.67 0.33 0 1 2012 0 0
110 0.67 0.6 0.83 0.33 0.5 1 2012 0 0
220 1 0.5 0.83 0.67 0 1 2012 1 1
65 0.78 0.7 1 0.33 0 0.5 2012 0 1
141 0.67 0.3 0.83 0 0.5 1 2012 1 0
117 1 0.3 1 0.67 0 0 2012 0 0
122 0.78 0.4 1 0.67 0 0.5 2012 1 1
63 0.89 0.4 0.83 1 0 1 2012 0 0
44 0.89 0.1 0.83 0 0 1 2012 1 1
52 0.89 0.5 1 0.67 0 1 2012 0 1
131 0 0 0 0 0 0 2012 0 0
101 0.67 0.4 1 0.33 0.5 0 2012 0 1
42 1 0.6 0.83 0.67 1 0.5 2012 0 1
152 1 0.4 1 0.33 0.5 1 2012 1 1
107 0.67 0.1 0.33 0 0.5 1 2012 1 0
77 0.89 0.3 0.83 0 0 1 2012 0 0
154 0.89 0.7 0.83 0.67 0 1 2012 1 0
103 0.56 0.3 0.17 0 0 1 2012 1 1
96 0.67 0.5 0.83 0.33 0.5 0 2012 0 1
175 1 0.3 0.83 0.67 1 1 2012 1 1
57 1 0.6 0.67 0.67 0.5 1 2012 0 1
112 1 0.9 1 1 0 1 2012 0 0
143 0.67 0.4 0.83 0 0.5 1 2012 1 0
49 0.44 0.3 1 0 0.5 0.5 2012 0 0
110 0.89 0.9 1 0.67 1 1 2012 1 1
131 0.44 0.5 1 0 0.5 0 2012 1 1
167 0.56 0.3 1 1 0.5 0.5 2012 1 0
56 0.89 0.6 0.83 0.67 0 0.5 2012 0 0
137 0.67 0.2 1 0.33 0 0.5 2012 1 0
86 0.89 0.4 0.83 1 0.5 1 2012 0 1
121 1 0.5 0.83 0.67 0.5 0.5 2012 1 1
149 0.78 0.4 0.83 0.67 0 0.5 2012 1 0
168 0.44 0 0 0 0 0 2012 1 0
140 0.89 0.2 1 0.33 0.5 1 2012 1 0
88 0.89 0.5 1 0.67 0.5 1 2012 0 1
168 0.89 0.3 1 0.67 0 0.5 2012 1 1
94 0.44 0 0 0 0 0 2012 1 1
51 1 0.5 0.83 1 0 1 2012 1 1
48 0.89 0.6 0.83 0.33 0 1 2012 0 0
145 0.67 0.3 0.83 0 0.5 0.5 2012 1 1
66 0.33 0 0 0 0 0 2012 1 1
85 0.78 0.3 0.67 0 0.5 0 2012 0 1
109 0.89 0.5 1 0.67 0.5 1 2012 1 0
63 0.78 0.4 0.67 0 0 1 2012 0 0
102 0.78 0.5 0.83 0.67 0 0.5 2012 0 1
162 0.89 0.7 1 1 1 0.5 2012 0 0
86 0.78 0.8 1 0.67 0.5 1 2012 0 1
114 0.78 0.6 1 0.33 0.5 1 2012 0 1
164 0.67 0.4 0.83 0.33 0 0.5 2012 1 0
119 0.89 0.5 0.83 0.33 0.5 0 2012 1 1
126 0.89 0.5 1 0 0.5 1 2012 1 0
132 0.78 0.3 1 0.33 0 1 2012 1 1
142 1 0.6 1 0 0.5 1 2012 1 1
83 1 0.3 0.67 0.67 0 0.5 2012 1 0
94 0.78 0.6 0.83 1 0.5 0.5 2012 0 1
81 0.78 0.3 0.33 0.33 0 1 2012 0 0
166 0.89 0.7 1 0.67 1 1 2012 1 1
110 0.89 0.7 1 1 0 1 2012 0 0
64 0.67 0.6 0.67 1 0.5 1 2012 0 1
93 1 0.5 1 0.33 0.5 0 2012 1 0
104 0.67 0.5 0.83 0.33 0 0.5 2012 0 0
105 0.56 0.4 0.67 0 0 1 2012 0 1
49 0.78 0.4 1 0.33 1 1 2012 0 1
88 1 0.7 1 1 0 1 2012 0 0
95 0.67 0.2 0.17 0 0.5 0 2012 0 1
102 0.78 0.5 0.83 0.67 0 0.5 2012 0 1
99 0.56 0.4 0.83 0.67 0.5 0 2012 0 0
63 1 0.2 1 0.67 1 1 2012 0 1
76 0.89 0.5 0.67 0.67 0 0 2012 0 0
109 0.44 0.4 0.5 0 0 1 2012 0 0
117 1 0.7 0.67 1 1 1 2012 0 1
57 0.89 0.6 0.83 0.67 1 0 2012 0 1
120 0.78 0.4 0.83 0 0 0 2012 0 0
73 0.89 0.5 1 0.67 1 1 2012 0 1
91 0.11 0 0.17 0 0 0 2012 0 0
108 0.89 0.7 1 0.67 0.5 1 2012 0 0
105 0.89 0.4 0.67 0.67 0 1 2012 0 1
117 1 0.5 0.67 1 0 1 2012 1 0
119 0.89 0.6 0.83 0.67 0 0.5 2012 0 0
31 1 0.8 0.5 0.67 0.5 0.5 2012 0 1


Summary of computational transaction
Raw Input view raw input (R code)
Raw Outputview raw output of R engine
Computing time17 seconds
R ServerBig Analytics Cloud Computing Center

\begin{tabular}{lllllllll}
\hline
Summary of computational transaction \tabularnewline
Raw Input view raw input (R code)  \tabularnewline
Raw Outputview raw output of R engine  \tabularnewline
Computing time17 seconds \tabularnewline
R ServerBig Analytics Cloud Computing Center \tabularnewline
\hline
\end{tabular}
%Source: https://freestatistics.org/blog/index.php?pk=&T=0

[TABLE]
[ROW]
Summary of computational transaction[/C][/ROW] [ROW]Raw Input[/C] view raw input (R code) [/C][/ROW] [ROW]Raw Output[/C]view raw output of R engine [/C][/ROW] [ROW]Computing time[/C]17 seconds[/C][/ROW] [ROW]R Server[/C]Big Analytics Cloud Computing Center[/C][/ROW] [/TABLE] Source: https://freestatistics.org/blog/index.php?pk=&T=0

Globally Unique Identifier (entire table): ba.freestatistics.org/blog/index.php?pk=&T=0

As an alternative you can also use a QR Code:  

The GUIDs for individual cells are displayed in the table below:

Summary of computational transaction
Raw Input view raw input (R code)
Raw Outputview raw output of R engine
Computing time17 seconds
R ServerBig Analytics Cloud Computing Center


Multiple Linear Regression - Estimated Regression Equation
LFM[t] = + 24879.9 + 20.2177Calculation[t] + 15.0106Algebraic_Reasoning[t] -6.96853Graphical_Interpretation[t] + 0.560038Proportionality_and_Ratio[t] -1.37891Probability_and_Sampling[t] -5.64846Estimation[t] -12.3256year[t] + 41.3052group[t] -7.69734gender[t] + 0.954521M1[t] + 2.91651M2[t] -3.35126M3[t] -2.08744M4[t] + 6.48511M5[t] + 3.3111M6[t] + 6.24443M7[t] -1.78651M8[t] + 12.8472M9[t] + 3.1895M10[t] + 7.18467M11[t] -0.0200312t + e[t]

\begin{tabular}{lllllllll}
\hline
Multiple Linear Regression - Estimated Regression Equation \tabularnewline
LFM[t] =  +  24879.9 +  20.2177Calculation[t] +  15.0106Algebraic_Reasoning[t] -6.96853Graphical_Interpretation[t] +  0.560038Proportionality_and_Ratio[t] -1.37891Probability_and_Sampling[t] -5.64846Estimation[t] -12.3256year[t] +  41.3052group[t] -7.69734gender[t] +  0.954521M1[t] +  2.91651M2[t] -3.35126M3[t] -2.08744M4[t] +  6.48511M5[t] +  3.3111M6[t] +  6.24443M7[t] -1.78651M8[t] +  12.8472M9[t] +  3.1895M10[t] +  7.18467M11[t] -0.0200312t  + e[t] \tabularnewline
 \tabularnewline
\hline
\end{tabular}
%Source: https://freestatistics.org/blog/index.php?pk=&T=1

[TABLE]
[ROW][C]Multiple Linear Regression - Estimated Regression Equation[/C][/ROW]
[ROW][C]LFM[t] =  +  24879.9 +  20.2177Calculation[t] +  15.0106Algebraic_Reasoning[t] -6.96853Graphical_Interpretation[t] +  0.560038Proportionality_and_Ratio[t] -1.37891Probability_and_Sampling[t] -5.64846Estimation[t] -12.3256year[t] +  41.3052group[t] -7.69734gender[t] +  0.954521M1[t] +  2.91651M2[t] -3.35126M3[t] -2.08744M4[t] +  6.48511M5[t] +  3.3111M6[t] +  6.24443M7[t] -1.78651M8[t] +  12.8472M9[t] +  3.1895M10[t] +  7.18467M11[t] -0.0200312t  + e[t][/C][/ROW]
[ROW][C][/C][/ROW]
[/TABLE]
Source: https://freestatistics.org/blog/index.php?pk=&T=1

Globally Unique Identifier (entire table): ba.freestatistics.org/blog/index.php?pk=&T=1

As an alternative you can also use a QR Code:  

The GUIDs for individual cells are displayed in the table below:

Multiple Linear Regression - Estimated Regression Equation
LFM[t] = + 24879.9 + 20.2177Calculation[t] + 15.0106Algebraic_Reasoning[t] -6.96853Graphical_Interpretation[t] + 0.560038Proportionality_and_Ratio[t] -1.37891Probability_and_Sampling[t] -5.64846Estimation[t] -12.3256year[t] + 41.3052group[t] -7.69734gender[t] + 0.954521M1[t] + 2.91651M2[t] -3.35126M3[t] -2.08744M4[t] + 6.48511M5[t] + 3.3111M6[t] + 6.24443M7[t] -1.78651M8[t] + 12.8472M9[t] + 3.1895M10[t] + 7.18467M11[t] -0.0200312t + e[t]


Multiple Linear Regression - Ordinary Least Squares
VariableParameterS.D.T-STATH0: parameter = 02-tail p-value1-tail p-value
(Intercept)+2.488e+04 1.737e+04+1.4320e+00 0.1533 0.07663
Calculation+20.22 14.13+1.4300e+00 0.1538 0.0769
Algebraic_Reasoning+15.01 13.33+1.1260e+00 0.2612 0.1306
Graphical_Interpretation-6.968 10.42-6.6890e-01 0.5042 0.2521
Proportionality_and_Ratio+0.56 6.549+8.5510e-02 0.9319 0.466
Probability_and_Sampling-1.379 6.247-2.2070e-01 0.8255 0.4127
Estimation-5.649 5.754-9.8170e-01 0.3272 0.1636
year-12.33 8.639-1.4270e+00 0.1549 0.07744
group+41.3 4.721+8.7490e+00 2.939e-16 1.47e-16
gender-7.697 4.465-1.7240e+00 0.08596 0.04298
M1+0.9545 9.997+9.5480e-02 0.924 0.462
M2+2.917 9.94+2.9340e-01 0.7694 0.3847
M3-3.351 10.05-3.3330e-01 0.7391 0.3696
M4-2.087 10.07-2.0720e-01 0.836 0.418
M5+6.485 10.24+6.3340e-01 0.5271 0.2635
M6+3.311 9.995+3.3130e-01 0.7407 0.3703
M7+6.244 10.05+6.2110e-01 0.5351 0.2675
M8-1.786 10.11-1.7680e-01 0.8598 0.4299
M9+12.85 10.1+1.2720e+00 0.2045 0.1023
M10+3.189 10.09+3.1620e-01 0.7521 0.376
M11+7.185 10.16+7.0740e-01 0.48 0.24
t-0.02003 0.05424-3.6930e-01 0.7122 0.3561

\begin{tabular}{lllllllll}
\hline
Multiple Linear Regression - Ordinary Least Squares \tabularnewline
Variable & Parameter & S.D. & T-STATH0: parameter = 0 & 2-tail p-value & 1-tail p-value \tabularnewline
(Intercept) & +2.488e+04 &  1.737e+04 & +1.4320e+00 &  0.1533 &  0.07663 \tabularnewline
Calculation & +20.22 &  14.13 & +1.4300e+00 &  0.1538 &  0.0769 \tabularnewline
Algebraic_Reasoning & +15.01 &  13.33 & +1.1260e+00 &  0.2612 &  0.1306 \tabularnewline
Graphical_Interpretation & -6.968 &  10.42 & -6.6890e-01 &  0.5042 &  0.2521 \tabularnewline
Proportionality_and_Ratio & +0.56 &  6.549 & +8.5510e-02 &  0.9319 &  0.466 \tabularnewline
Probability_and_Sampling & -1.379 &  6.247 & -2.2070e-01 &  0.8255 &  0.4127 \tabularnewline
Estimation & -5.649 &  5.754 & -9.8170e-01 &  0.3272 &  0.1636 \tabularnewline
year & -12.33 &  8.639 & -1.4270e+00 &  0.1549 &  0.07744 \tabularnewline
group & +41.3 &  4.721 & +8.7490e+00 &  2.939e-16 &  1.47e-16 \tabularnewline
gender & -7.697 &  4.465 & -1.7240e+00 &  0.08596 &  0.04298 \tabularnewline
M1 & +0.9545 &  9.997 & +9.5480e-02 &  0.924 &  0.462 \tabularnewline
M2 & +2.917 &  9.94 & +2.9340e-01 &  0.7694 &  0.3847 \tabularnewline
M3 & -3.351 &  10.05 & -3.3330e-01 &  0.7391 &  0.3696 \tabularnewline
M4 & -2.087 &  10.07 & -2.0720e-01 &  0.836 &  0.418 \tabularnewline
M5 & +6.485 &  10.24 & +6.3340e-01 &  0.5271 &  0.2635 \tabularnewline
M6 & +3.311 &  9.995 & +3.3130e-01 &  0.7407 &  0.3703 \tabularnewline
M7 & +6.244 &  10.05 & +6.2110e-01 &  0.5351 &  0.2675 \tabularnewline
M8 & -1.786 &  10.11 & -1.7680e-01 &  0.8598 &  0.4299 \tabularnewline
M9 & +12.85 &  10.1 & +1.2720e+00 &  0.2045 &  0.1023 \tabularnewline
M10 & +3.189 &  10.09 & +3.1620e-01 &  0.7521 &  0.376 \tabularnewline
M11 & +7.185 &  10.16 & +7.0740e-01 &  0.48 &  0.24 \tabularnewline
t & -0.02003 &  0.05424 & -3.6930e-01 &  0.7122 &  0.3561 \tabularnewline
\hline
\end{tabular}
%Source: https://freestatistics.org/blog/index.php?pk=&T=2

[TABLE]
[ROW][C]Multiple Linear Regression - Ordinary Least Squares[/C][/ROW]
[ROW][C]Variable[/C][C]Parameter[/C][C]S.D.[/C][C]T-STATH0: parameter = 0[/C][C]2-tail p-value[/C][C]1-tail p-value[/C][/ROW]
[ROW][C](Intercept)[/C][C]+2.488e+04[/C][C] 1.737e+04[/C][C]+1.4320e+00[/C][C] 0.1533[/C][C] 0.07663[/C][/ROW]
[ROW][C]Calculation[/C][C]+20.22[/C][C] 14.13[/C][C]+1.4300e+00[/C][C] 0.1538[/C][C] 0.0769[/C][/ROW]
[ROW][C]Algebraic_Reasoning[/C][C]+15.01[/C][C] 13.33[/C][C]+1.1260e+00[/C][C] 0.2612[/C][C] 0.1306[/C][/ROW]
[ROW][C]Graphical_Interpretation[/C][C]-6.968[/C][C] 10.42[/C][C]-6.6890e-01[/C][C] 0.5042[/C][C] 0.2521[/C][/ROW]
[ROW][C]Proportionality_and_Ratio[/C][C]+0.56[/C][C] 6.549[/C][C]+8.5510e-02[/C][C] 0.9319[/C][C] 0.466[/C][/ROW]
[ROW][C]Probability_and_Sampling[/C][C]-1.379[/C][C] 6.247[/C][C]-2.2070e-01[/C][C] 0.8255[/C][C] 0.4127[/C][/ROW]
[ROW][C]Estimation[/C][C]-5.649[/C][C] 5.754[/C][C]-9.8170e-01[/C][C] 0.3272[/C][C] 0.1636[/C][/ROW]
[ROW][C]year[/C][C]-12.33[/C][C] 8.639[/C][C]-1.4270e+00[/C][C] 0.1549[/C][C] 0.07744[/C][/ROW]
[ROW][C]group[/C][C]+41.3[/C][C] 4.721[/C][C]+8.7490e+00[/C][C] 2.939e-16[/C][C] 1.47e-16[/C][/ROW]
[ROW][C]gender[/C][C]-7.697[/C][C] 4.465[/C][C]-1.7240e+00[/C][C] 0.08596[/C][C] 0.04298[/C][/ROW]
[ROW][C]M1[/C][C]+0.9545[/C][C] 9.997[/C][C]+9.5480e-02[/C][C] 0.924[/C][C] 0.462[/C][/ROW]
[ROW][C]M2[/C][C]+2.917[/C][C] 9.94[/C][C]+2.9340e-01[/C][C] 0.7694[/C][C] 0.3847[/C][/ROW]
[ROW][C]M3[/C][C]-3.351[/C][C] 10.05[/C][C]-3.3330e-01[/C][C] 0.7391[/C][C] 0.3696[/C][/ROW]
[ROW][C]M4[/C][C]-2.087[/C][C] 10.07[/C][C]-2.0720e-01[/C][C] 0.836[/C][C] 0.418[/C][/ROW]
[ROW][C]M5[/C][C]+6.485[/C][C] 10.24[/C][C]+6.3340e-01[/C][C] 0.5271[/C][C] 0.2635[/C][/ROW]
[ROW][C]M6[/C][C]+3.311[/C][C] 9.995[/C][C]+3.3130e-01[/C][C] 0.7407[/C][C] 0.3703[/C][/ROW]
[ROW][C]M7[/C][C]+6.244[/C][C] 10.05[/C][C]+6.2110e-01[/C][C] 0.5351[/C][C] 0.2675[/C][/ROW]
[ROW][C]M8[/C][C]-1.786[/C][C] 10.11[/C][C]-1.7680e-01[/C][C] 0.8598[/C][C] 0.4299[/C][/ROW]
[ROW][C]M9[/C][C]+12.85[/C][C] 10.1[/C][C]+1.2720e+00[/C][C] 0.2045[/C][C] 0.1023[/C][/ROW]
[ROW][C]M10[/C][C]+3.189[/C][C] 10.09[/C][C]+3.1620e-01[/C][C] 0.7521[/C][C] 0.376[/C][/ROW]
[ROW][C]M11[/C][C]+7.185[/C][C] 10.16[/C][C]+7.0740e-01[/C][C] 0.48[/C][C] 0.24[/C][/ROW]
[ROW][C]t[/C][C]-0.02003[/C][C] 0.05424[/C][C]-3.6930e-01[/C][C] 0.7122[/C][C] 0.3561[/C][/ROW]
[/TABLE]
Source: https://freestatistics.org/blog/index.php?pk=&T=2

Globally Unique Identifier (entire table): ba.freestatistics.org/blog/index.php?pk=&T=2

As an alternative you can also use a QR Code:  

The GUIDs for individual cells are displayed in the table below:

Multiple Linear Regression - Ordinary Least Squares
VariableParameterS.D.T-STATH0: parameter = 02-tail p-value1-tail p-value
(Intercept)+2.488e+04 1.737e+04+1.4320e+00 0.1533 0.07663
Calculation+20.22 14.13+1.4300e+00 0.1538 0.0769
Algebraic_Reasoning+15.01 13.33+1.1260e+00 0.2612 0.1306
Graphical_Interpretation-6.968 10.42-6.6890e-01 0.5042 0.2521
Proportionality_and_Ratio+0.56 6.549+8.5510e-02 0.9319 0.466
Probability_and_Sampling-1.379 6.247-2.2070e-01 0.8255 0.4127
Estimation-5.649 5.754-9.8170e-01 0.3272 0.1636
year-12.33 8.639-1.4270e+00 0.1549 0.07744
group+41.3 4.721+8.7490e+00 2.939e-16 1.47e-16
gender-7.697 4.465-1.7240e+00 0.08596 0.04298
M1+0.9545 9.997+9.5480e-02 0.924 0.462
M2+2.917 9.94+2.9340e-01 0.7694 0.3847
M3-3.351 10.05-3.3330e-01 0.7391 0.3696
M4-2.087 10.07-2.0720e-01 0.836 0.418
M5+6.485 10.24+6.3340e-01 0.5271 0.2635
M6+3.311 9.995+3.3130e-01 0.7407 0.3703
M7+6.244 10.05+6.2110e-01 0.5351 0.2675
M8-1.786 10.11-1.7680e-01 0.8598 0.4299
M9+12.85 10.1+1.2720e+00 0.2045 0.1023
M10+3.189 10.09+3.1620e-01 0.7521 0.376
M11+7.185 10.16+7.0740e-01 0.48 0.24
t-0.02003 0.05424-3.6930e-01 0.7122 0.3561


Multiple Linear Regression - Regression Statistics
Multiple R 0.5799
R-squared 0.3363
Adjusted R-squared 0.2818
F-TEST (value) 6.176
F-TEST (DF numerator)21
F-TEST (DF denominator)256
p-value 8.205e-14
Multiple Linear Regression - Residual Statistics
Residual Standard Deviation 33.76
Sum Squared Residuals 2.917e+05

\begin{tabular}{lllllllll}
\hline
Multiple Linear Regression - Regression Statistics \tabularnewline
Multiple R &  0.5799 \tabularnewline
R-squared &  0.3363 \tabularnewline
Adjusted R-squared &  0.2818 \tabularnewline
F-TEST (value) &  6.176 \tabularnewline
F-TEST (DF numerator) & 21 \tabularnewline
F-TEST (DF denominator) & 256 \tabularnewline
p-value &  8.205e-14 \tabularnewline
Multiple Linear Regression - Residual Statistics \tabularnewline
Residual Standard Deviation &  33.76 \tabularnewline
Sum Squared Residuals &  2.917e+05 \tabularnewline
\hline
\end{tabular}
%Source: https://freestatistics.org/blog/index.php?pk=&T=3

[TABLE]
[ROW][C]Multiple Linear Regression - Regression Statistics[/C][/ROW]
[ROW][C]Multiple R[/C][C] 0.5799[/C][/ROW]
[ROW][C]R-squared[/C][C] 0.3363[/C][/ROW]
[ROW][C]Adjusted R-squared[/C][C] 0.2818[/C][/ROW]
[ROW][C]F-TEST (value)[/C][C] 6.176[/C][/ROW]
[ROW][C]F-TEST (DF numerator)[/C][C]21[/C][/ROW]
[ROW][C]F-TEST (DF denominator)[/C][C]256[/C][/ROW]
[ROW][C]p-value[/C][C] 8.205e-14[/C][/ROW]
[ROW][C]Multiple Linear Regression - Residual Statistics[/C][/ROW]
[ROW][C]Residual Standard Deviation[/C][C] 33.76[/C][/ROW]
[ROW][C]Sum Squared Residuals[/C][C] 2.917e+05[/C][/ROW]
[/TABLE]
Source: https://freestatistics.org/blog/index.php?pk=&T=3

Globally Unique Identifier (entire table): ba.freestatistics.org/blog/index.php?pk=&T=3

As an alternative you can also use a QR Code:  

The GUIDs for individual cells are displayed in the table below:

Multiple Linear Regression - Regression Statistics
Multiple R 0.5799
R-squared 0.3363
Adjusted R-squared 0.2818
F-TEST (value) 6.176
F-TEST (DF numerator)21
F-TEST (DF denominator)256
p-value 8.205e-14
Multiple Linear Regression - Residual Statistics
Residual Standard Deviation 33.76
Sum Squared Residuals 2.917e+05


Menu of Residual Diagnostics
DescriptionLink
HistogramCompute
Central TendencyCompute
QQ PlotCompute
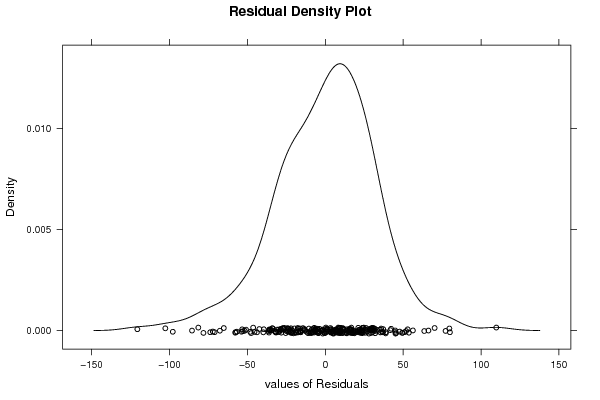
Kernel Density PlotCompute
Skewness/Kurtosis TestCompute
Skewness-Kurtosis PlotCompute
Harrell-Davis PlotCompute
Bootstrap Plot -- Central TendencyCompute
Blocked Bootstrap Plot -- Central TendencyCompute
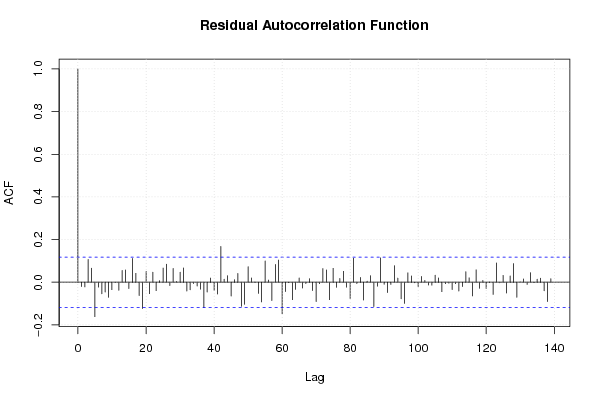
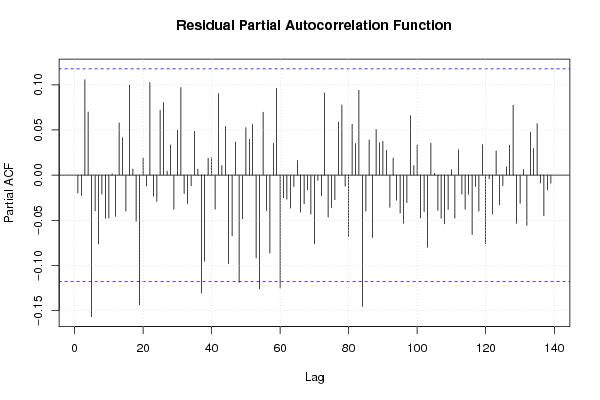
(Partial) Autocorrelation PlotCompute
Spectral AnalysisCompute
Tukey lambda PPCC PlotCompute
Box-Cox Normality PlotCompute
Summary StatisticsCompute

\begin{tabular}{lllllllll}
\hline
Menu of Residual Diagnostics \tabularnewline
Description & Link \tabularnewline
Histogram & Compute \tabularnewline
Central Tendency & Compute \tabularnewline
QQ Plot & Compute \tabularnewline
Kernel Density Plot & Compute \tabularnewline
Skewness/Kurtosis Test & Compute \tabularnewline
Skewness-Kurtosis Plot & Compute \tabularnewline
Harrell-Davis Plot & Compute \tabularnewline
Bootstrap Plot -- Central Tendency & Compute \tabularnewline
Blocked Bootstrap Plot -- Central Tendency & Compute \tabularnewline
(Partial) Autocorrelation Plot & Compute \tabularnewline
Spectral Analysis & Compute \tabularnewline
Tukey lambda PPCC Plot & Compute \tabularnewline
Box-Cox Normality Plot & Compute \tabularnewline
Summary Statistics & Compute \tabularnewline
\hline
\end{tabular}
%Source: https://freestatistics.org/blog/index.php?pk=&T=4

[TABLE]
[ROW][C]Menu of Residual Diagnostics[/C][/ROW]
[ROW][C]Description[/C][C]Link[/C][/ROW]
[ROW][C]Histogram[/C][C]Compute[/C][/ROW]
[ROW][C]Central Tendency[/C][C]Compute[/C][/ROW]
[ROW][C]QQ Plot[/C][C]Compute[/C][/ROW]
[ROW][C]Kernel Density Plot[/C][C]Compute[/C][/ROW]
[ROW][C]Skewness/Kurtosis Test[/C][C]Compute[/C][/ROW]
[ROW][C]Skewness-Kurtosis Plot[/C][C]Compute[/C][/ROW]
[ROW][C]Harrell-Davis Plot[/C][C]Compute[/C][/ROW]
[ROW][C]Bootstrap Plot -- Central Tendency[/C][C]Compute[/C][/ROW]
[ROW][C]Blocked Bootstrap Plot -- Central Tendency[/C][C]Compute[/C][/ROW]
[ROW][C](Partial) Autocorrelation Plot[/C][C]Compute[/C][/ROW]
[ROW][C]Spectral Analysis[/C][C]Compute[/C][/ROW]
[ROW][C]Tukey lambda PPCC Plot[/C][C]Compute[/C][/ROW]
[ROW][C]Box-Cox Normality Plot[/C][C]Compute[/C][/ROW]
[ROW][C]Summary Statistics[/C][C]Compute[/C][/ROW]
[/TABLE]
Source: https://freestatistics.org/blog/index.php?pk=&T=4

Globally Unique Identifier (entire table): ba.freestatistics.org/blog/index.php?pk=&T=4

As an alternative you can also use a QR Code:  

The GUIDs for individual cells are displayed in the table below:

Menu of Residual Diagnostics
DescriptionLink
HistogramCompute
Central TendencyCompute
QQ PlotCompute
Kernel Density PlotCompute
Skewness/Kurtosis TestCompute
Skewness-Kurtosis PlotCompute
Harrell-Davis PlotCompute
Bootstrap Plot -- Central TendencyCompute
Blocked Bootstrap Plot -- Central TendencyCompute
(Partial) Autocorrelation PlotCompute
Spectral AnalysisCompute
Tukey lambda PPCC PlotCompute
Box-Cox Normality PlotCompute
Summary StatisticsCompute


Ramsey RESET F-Test for powers (2 and 3) of fitted values
> reset_test_fitted
	RESET test
data:  mylm
RESET = 1.7844, df1 = 2, df2 = 254, p-value = 0.17
Ramsey RESET F-Test for powers (2 and 3) of regressors
> reset_test_regressors
	RESET test
data:  mylm
RESET = 0.40395, df1 = 42, df2 = 214, p-value = 0.9996
Ramsey RESET F-Test for powers (2 and 3) of principal components
> reset_test_principal_components
	RESET test
data:  mylm
RESET = 0.95287, df1 = 2, df2 = 254, p-value = 0.387

\begin{tabular}{lllllllll}
\hline
Ramsey RESET F-Test for powers (2 and 3) of fitted values \tabularnewline
> reset_test_fitted
	RESET test
data:  mylm
RESET = 1.7844, df1 = 2, df2 = 254, p-value = 0.17
\tabularnewline Ramsey RESET F-Test for powers (2 and 3) of regressors \tabularnewline
> reset_test_regressors
	RESET test
data:  mylm
RESET = 0.40395, df1 = 42, df2 = 214, p-value = 0.9996
\tabularnewline Ramsey RESET F-Test for powers (2 and 3) of principal components \tabularnewline
> reset_test_principal_components
	RESET test
data:  mylm
RESET = 0.95287, df1 = 2, df2 = 254, p-value = 0.387
\tabularnewline \hline \end{tabular} %Source: https://freestatistics.org/blog/index.php?pk=&T=5

[TABLE]
[ROW][C]Ramsey RESET F-Test for powers (2 and 3) of fitted values[/C][/ROW]
[ROW][C]
> reset_test_fitted
	RESET test
data:  mylm
RESET = 1.7844, df1 = 2, df2 = 254, p-value = 0.17
[/C][/ROW] [ROW][C]Ramsey RESET F-Test for powers (2 and 3) of regressors[/C][/ROW] [ROW][C]
> reset_test_regressors
	RESET test
data:  mylm
RESET = 0.40395, df1 = 42, df2 = 214, p-value = 0.9996
[/C][/ROW] [ROW][C]Ramsey RESET F-Test for powers (2 and 3) of principal components[/C][/ROW] [ROW][C]
> reset_test_principal_components
	RESET test
data:  mylm
RESET = 0.95287, df1 = 2, df2 = 254, p-value = 0.387
[/C][/ROW] [/TABLE] Source: https://freestatistics.org/blog/index.php?pk=&T=5

Globally Unique Identifier (entire table): ba.freestatistics.org/blog/index.php?pk=&T=5

As an alternative you can also use a QR Code:  

The GUIDs for individual cells are displayed in the table below:

Ramsey RESET F-Test for powers (2 and 3) of fitted values
> reset_test_fitted
	RESET test
data:  mylm
RESET = 1.7844, df1 = 2, df2 = 254, p-value = 0.17
Ramsey RESET F-Test for powers (2 and 3) of regressors
> reset_test_regressors
	RESET test
data:  mylm
RESET = 0.40395, df1 = 42, df2 = 214, p-value = 0.9996
Ramsey RESET F-Test for powers (2 and 3) of principal components
> reset_test_principal_components
	RESET test
data:  mylm
RESET = 0.95287, df1 = 2, df2 = 254, p-value = 0.387


Variance Inflation Factors (Multicollinearity)
> vif
              Calculation       Algebraic_Reasoning  Graphical_Interpretation 
                 1.577645                  1.607779                  1.533477 
Proportionality_and_Ratio  Probability_and_Sampling                Estimation 
                 1.300979                  1.296287                  1.217018 
                     year                     group                    gender 
                 4.380023                  1.358677                  1.193408 
                       M1                        M2                        M3 
                 1.922978                  1.901033                  1.871115 
                       M4                        M5                        M6 
                 1.878633                  1.940996                  1.849343 
                       M7                        M8                        M9 
                 1.871060                  1.890556                  1.888720 
                      M10                       M11                         t 
                 1.883348                  1.909858                  4.622565 

\begin{tabular}{lllllllll}
\hline
Variance Inflation Factors (Multicollinearity) \tabularnewline
> vif
              Calculation       Algebraic_Reasoning  Graphical_Interpretation 
                 1.577645                  1.607779                  1.533477 
Proportionality_and_Ratio  Probability_and_Sampling                Estimation 
                 1.300979                  1.296287                  1.217018 
                     year                     group                    gender 
                 4.380023                  1.358677                  1.193408 
                       M1                        M2                        M3 
                 1.922978                  1.901033                  1.871115 
                       M4                        M5                        M6 
                 1.878633                  1.940996                  1.849343 
                       M7                        M8                        M9 
                 1.871060                  1.890556                  1.888720 
                      M10                       M11                         t 
                 1.883348                  1.909858                  4.622565 
\tabularnewline \hline \end{tabular} %Source: https://freestatistics.org/blog/index.php?pk=&T=6

[TABLE]
[ROW][C]Variance Inflation Factors (Multicollinearity)[/C][/ROW]
[ROW][C]
> vif
              Calculation       Algebraic_Reasoning  Graphical_Interpretation 
                 1.577645                  1.607779                  1.533477 
Proportionality_and_Ratio  Probability_and_Sampling                Estimation 
                 1.300979                  1.296287                  1.217018 
                     year                     group                    gender 
                 4.380023                  1.358677                  1.193408 
                       M1                        M2                        M3 
                 1.922978                  1.901033                  1.871115 
                       M4                        M5                        M6 
                 1.878633                  1.940996                  1.849343 
                       M7                        M8                        M9 
                 1.871060                  1.890556                  1.888720 
                      M10                       M11                         t 
                 1.883348                  1.909858                  4.622565 
[/C][/ROW] [/TABLE] Source: https://freestatistics.org/blog/index.php?pk=&T=6

Globally Unique Identifier (entire table): ba.freestatistics.org/blog/index.php?pk=&T=6

As an alternative you can also use a QR Code:  

The GUIDs for individual cells are displayed in the table below:

Variance Inflation Factors (Multicollinearity)
> vif
              Calculation       Algebraic_Reasoning  Graphical_Interpretation 
                 1.577645                  1.607779                  1.533477 
Proportionality_and_Ratio  Probability_and_Sampling                Estimation 
                 1.300979                  1.296287                  1.217018 
                     year                     group                    gender 
                 4.380023                  1.358677                  1.193408 
                       M1                        M2                        M3 
                 1.922978                  1.901033                  1.871115 
                       M4                        M5                        M6 
                 1.878633                  1.940996                  1.849343 
                       M7                        M8                        M9 
                 1.871060                  1.890556                  1.888720 
                      M10                       M11                         t 
                 1.883348                  1.909858                  4.622565 


Parameters (Session):
par1 = 11 ; par2 = Do not include Seasonal DummiesInclude Seasonal Dummies ; par3 = No Linear TrendLinear Trend ; par4 = 00 ; par5 = 00 ; par6 = 1212 ;
Parameters (R input):
par1 = 1 ; par2 = Include Seasonal Dummies ; par3 = Linear Trend ; par4 = 0 ; par5 = 0 ; par6 = 12 ;
R code (references can be found in the software module):
par6 <- '12'
par5 <- '0'
par4 <- '0'
par3 <- 'No Linear Trend'
par2 <- 'Do not include Seasonal Dummies'
par1 <- '1'
library(lattice)
library(lmtest)
library(car)
library(MASS)
n25 <- 25 #minimum number of obs. for Goldfeld-Quandt test
mywarning <- ''
par6 <- as.numeric(par6)
if(is.na(par6)) {
par6 <- 12
mywarning = 'Warning: you did not specify the seasonality. The seasonal period was set to s = 12.'
}
par1 <- as.numeric(par1)
if(is.na(par1)) {
par1 <- 1
mywarning = 'Warning: you did not specify the column number of the endogenous series! The first column was selected by default.'
}
if (par4=='') par4 <- 0
par4 <- as.numeric(par4)
if (!is.numeric(par4)) par4 <- 0
if (par5=='') par5 <- 0
par5 <- as.numeric(par5)
if (!is.numeric(par5)) par5 <- 0
x <- na.omit(t(y))
k <- length(x[1,])
n <- length(x[,1])
x1 <- cbind(x[,par1], x[,1:k!=par1])
mycolnames <- c(colnames(x)[par1], colnames(x)[1:k!=par1])
colnames(x1) <- mycolnames #colnames(x)[par1]
x <- x1
if (par3 == 'First Differences'){
(n <- n -1)
x2 <- array(0, dim=c(n,k), dimnames=list(1:n, paste('(1-B)',colnames(x),sep='')))
for (i in 1:n) {
for (j in 1:k) {
x2[i,j] <- x[i+1,j] - x[i,j]
}
}
x <- x2
}
if (par3 == 'Seasonal Differences (s)'){
(n <- n - par6)
x2 <- array(0, dim=c(n,k), dimnames=list(1:n, paste('(1-Bs)',colnames(x),sep='')))
for (i in 1:n) {
for (j in 1:k) {
x2[i,j] <- x[i+par6,j] - x[i,j]
}
}
x <- x2
}
if (par3 == 'First and Seasonal Differences (s)'){
(n <- n -1)
x2 <- array(0, dim=c(n,k), dimnames=list(1:n, paste('(1-B)',colnames(x),sep='')))
for (i in 1:n) {
for (j in 1:k) {
x2[i,j] <- x[i+1,j] - x[i,j]
}
}
x <- x2
(n <- n - par6)
x2 <- array(0, dim=c(n,k), dimnames=list(1:n, paste('(1-Bs)',colnames(x),sep='')))
for (i in 1:n) {
for (j in 1:k) {
x2[i,j] <- x[i+par6,j] - x[i,j]
}
}
x <- x2
}
if(par4 > 0) {
x2 <- array(0, dim=c(n-par4,par4), dimnames=list(1:(n-par4), paste(colnames(x)[par1],'(t-',1:par4,')',sep='')))
for (i in 1:(n-par4)) {
for (j in 1:par4) {
x2[i,j] <- x[i+par4-j,par1]
}
}
x <- cbind(x[(par4+1):n,], x2)
n <- n - par4
}
if(par5 > 0) {
x2 <- array(0, dim=c(n-par5*par6,par5), dimnames=list(1:(n-par5*par6), paste(colnames(x)[par1],'(t-',1:par5,'s)',sep='')))
for (i in 1:(n-par5*par6)) {
for (j in 1:par5) {
x2[i,j] <- x[i+par5*par6-j*par6,par1]
}
}
x <- cbind(x[(par5*par6+1):n,], x2)
n <- n - par5*par6
}
if (par2 == 'Include Seasonal Dummies'){
x2 <- array(0, dim=c(n,par6-1), dimnames=list(1:n, paste('M', seq(1:(par6-1)), sep ='')))
for (i in 1:(par6-1)){
x2[seq(i,n,par6),i] <- 1
}
x <- cbind(x, x2)
}
if (par2 == 'Include Monthly Dummies'){
x2 <- array(0, dim=c(n,11), dimnames=list(1:n, paste('M', seq(1:11), sep ='')))
for (i in 1:11){
x2[seq(i,n,12),i] <- 1
}
x <- cbind(x, x2)
}
if (par2 == 'Include Quarterly Dummies'){
x2 <- array(0, dim=c(n,3), dimnames=list(1:n, paste('Q', seq(1:3), sep ='')))
for (i in 1:3){
x2[seq(i,n,4),i] <- 1
}
x <- cbind(x, x2)
}
(k <- length(x[n,]))
if (par3 == 'Linear Trend'){
x <- cbind(x, c(1:n))
colnames(x)[k+1] <- 't'
}
print(x)
(k <- length(x[n,]))
head(x)
df <- as.data.frame(x)
(mylm <- lm(df))
(mysum <- summary(mylm))
if (n > n25) {
kp3 <- k + 3
nmkm3 <- n - k - 3
gqarr <- array(NA, dim=c(nmkm3-kp3+1,3))
numgqtests <- 0
numsignificant1 <- 0
numsignificant5 <- 0
numsignificant10 <- 0
for (mypoint in kp3:nmkm3) {
j <- 0
numgqtests <- numgqtests + 1
for (myalt in c('greater', 'two.sided', 'less')) {
j <- j + 1
gqarr[mypoint-kp3+1,j] <- gqtest(mylm, point=mypoint, alternative=myalt)$p.value
}
if (gqarr[mypoint-kp3+1,2] < 0.01) numsignificant1 <- numsignificant1 + 1
if (gqarr[mypoint-kp3+1,2] < 0.05) numsignificant5 <- numsignificant5 + 1
if (gqarr[mypoint-kp3+1,2] < 0.10) numsignificant10 <- numsignificant10 + 1
}
gqarr
}
bitmap(file='test0.png')
plot(x[,1], type='l', main='Actuals and Interpolation', ylab='value of Actuals and Interpolation (dots)', xlab='time or index')
points(x[,1]-mysum$resid)
grid()
dev.off()
bitmap(file='test1.png')
plot(mysum$resid, type='b', pch=19, main='Residuals', ylab='value of Residuals', xlab='time or index')
grid()
dev.off()
bitmap(file='test2.png')
sresid <- studres(mylm)
hist(sresid, freq=FALSE, main='Distribution of Studentized Residuals')
xfit<-seq(min(sresid),max(sresid),length=40)
yfit<-dnorm(xfit)
lines(xfit, yfit)
grid()
dev.off()
bitmap(file='test3.png')
densityplot(~mysum$resid,col='black',main='Residual Density Plot', xlab='values of Residuals')
dev.off()
bitmap(file='test4.png')
qqPlot(mylm, main='QQ Plot')
grid()
dev.off()
(myerror <- as.ts(mysum$resid))
bitmap(file='test5.png')
dum <- cbind(lag(myerror,k=1),myerror)
dum
dum1 <- dum[2:length(myerror),]
dum1
z <- as.data.frame(dum1)
print(z)
plot(z,main=paste('Residual Lag plot, lowess, and regression line'), ylab='values of Residuals', xlab='lagged values of Residuals')
lines(lowess(z))
abline(lm(z))
grid()
dev.off()
bitmap(file='test6.png')
acf(mysum$resid, lag.max=length(mysum$resid)/2, main='Residual Autocorrelation Function')
grid()
dev.off()
bitmap(file='test7.png')
pacf(mysum$resid, lag.max=length(mysum$resid)/2, main='Residual Partial Autocorrelation Function')
grid()
dev.off()
bitmap(file='test8.png')
opar <- par(mfrow = c(2,2), oma = c(0, 0, 1.1, 0))
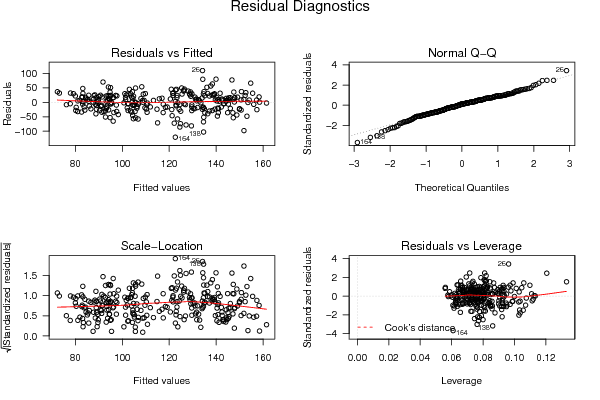
plot(mylm, las = 1, sub='Residual Diagnostics')
par(opar)
dev.off()
if (n > n25) {
bitmap(file='test9.png')
plot(kp3:nmkm3,gqarr[,2], main='Goldfeld-Quandt test',ylab='2-sided p-value',xlab='breakpoint')
grid()
dev.off()
}
load(file='createtable')
a<-table.start()
a<-table.row.start(a)
a<-table.element(a, 'Multiple Linear Regression - Estimated Regression Equation', 1, TRUE)
a<-table.row.end(a)
myeq <- colnames(x)[1]
myeq <- paste(myeq, '[t] = ', sep='')
for (i in 1:k){
if (mysum$coefficients[i,1] > 0) myeq <- paste(myeq, '+', '')
myeq <- paste(myeq, signif(mysum$coefficients[i,1],6), sep=' ')
if (rownames(mysum$coefficients)[i] != '(Intercept)') {
myeq <- paste(myeq, rownames(mysum$coefficients)[i], sep='')
if (rownames(mysum$coefficients)[i] != 't') myeq <- paste(myeq, '[t]', sep='')
}
}
myeq <- paste(myeq, ' + e[t]')
a<-table.row.start(a)
a<-table.element(a, myeq)
a<-table.row.end(a)
a<-table.row.start(a)
a<-table.element(a, mywarning)
a<-table.row.end(a)
a<-table.end(a)
table.save(a,file='mytable1.tab')
a<-table.start()
a<-table.row.start(a)
a<-table.element(a,'Multiple Linear Regression - Ordinary Least Squares', 6, TRUE)
a<-table.row.end(a)
a<-table.row.start(a)
a<-table.element(a,'Variable',header=TRUE)
a<-table.element(a,'Parameter',header=TRUE)
a<-table.element(a,'S.D.',header=TRUE)
a<-table.element(a,'T-STAT
H0: parameter = 0',header=TRUE)
a<-table.element(a,'2-tail p-value',header=TRUE)
a<-table.element(a,'1-tail p-value',header=TRUE)
a<-table.row.end(a)
for (i in 1:k){
a<-table.row.start(a)
a<-table.element(a,rownames(mysum$coefficients)[i],header=TRUE)
a<-table.element(a,formatC(signif(mysum$coefficients[i,1],5),format='g',flag='+'))
a<-table.element(a,formatC(signif(mysum$coefficients[i,2],5),format='g',flag=' '))
a<-table.element(a,formatC(signif(mysum$coefficients[i,3],4),format='e',flag='+'))
a<-table.element(a,formatC(signif(mysum$coefficients[i,4],4),format='g',flag=' '))
a<-table.element(a,formatC(signif(mysum$coefficients[i,4]/2,4),format='g',flag=' '))
a<-table.row.end(a)
}
a<-table.end(a)
table.save(a,file='mytable2.tab')
a<-table.start()
a<-table.row.start(a)
a<-table.element(a, 'Multiple Linear Regression - Regression Statistics', 2, TRUE)
a<-table.row.end(a)
a<-table.row.start(a)
a<-table.element(a, 'Multiple R',1,TRUE)
a<-table.element(a,formatC(signif(sqrt(mysum$r.squared),6),format='g',flag=' '))
a<-table.row.end(a)
a<-table.row.start(a)
a<-table.element(a, 'R-squared',1,TRUE)
a<-table.element(a,formatC(signif(mysum$r.squared,6),format='g',flag=' '))
a<-table.row.end(a)
a<-table.row.start(a)
a<-table.element(a, 'Adjusted R-squared',1,TRUE)
a<-table.element(a,formatC(signif(mysum$adj.r.squared,6),format='g',flag=' '))
a<-table.row.end(a)
a<-table.row.start(a)
a<-table.element(a, 'F-TEST (value)',1,TRUE)
a<-table.element(a,formatC(signif(mysum$fstatistic[1],6),format='g',flag=' '))
a<-table.row.end(a)
a<-table.row.start(a)
a<-table.element(a, 'F-TEST (DF numerator)',1,TRUE)
a<-table.element(a, signif(mysum$fstatistic[2],6))
a<-table.row.end(a)
a<-table.row.start(a)
a<-table.element(a, 'F-TEST (DF denominator)',1,TRUE)
a<-table.element(a, signif(mysum$fstatistic[3],6))
a<-table.row.end(a)
a<-table.row.start(a)
a<-table.element(a, 'p-value',1,TRUE)
a<-table.element(a,formatC(signif(1-pf(mysum$fstatistic[1],mysum$fstatistic[2],mysum$fstatistic[3]),6),format='g',flag=' '))
a<-table.row.end(a)
a<-table.row.start(a)
a<-table.element(a, 'Multiple Linear Regression - Residual Statistics', 2, TRUE)
a<-table.row.end(a)
a<-table.row.start(a)
a<-table.element(a, 'Residual Standard Deviation',1,TRUE)
a<-table.element(a,formatC(signif(mysum$sigma,6),format='g',flag=' '))
a<-table.row.end(a)
a<-table.row.start(a)
a<-table.element(a, 'Sum Squared Residuals',1,TRUE)
a<-table.element(a,formatC(signif(sum(myerror*myerror),6),format='g',flag=' '))
a<-table.row.end(a)
a<-table.end(a)
table.save(a,file='mytable3.tab')
myr <- as.numeric(mysum$resid)
myr
a <-table.start()
a <- table.row.start(a)
a <- table.element(a,'Menu of Residual Diagnostics',2,TRUE)
a <- table.row.end(a)
a <- table.row.start(a)
a <- table.element(a,'Description',1,TRUE)
a <- table.element(a,'Link',1,TRUE)
a <- table.row.end(a)
a <- table.row.start(a)
a <-table.element(a,'Histogram',1,header=TRUE)
a <- table.element(a,hyperlink( paste('https://supernova.wessa.net/rwasp_histogram.wasp?convertgetintopost=1&data=',paste(as.character(mysum$resid),sep='',collapse=' '),sep='') ,'Compute','Click here to examine the Residuals.'),1)
a <- table.row.end(a)
a <- table.row.start(a)
a <-table.element(a,'Central Tendency',1,header=TRUE)
a <- table.element(a,hyperlink( paste('https://supernova.wessa.net/rwasp_centraltendency.wasp?convertgetintopost=1&data=',paste(as.character(mysum$resid),sep='',collapse=' '),sep='') ,'Compute','Click here to examine the Residuals.'),1)
a <- table.row.end(a)
a <- table.row.start(a)
a <-table.element(a,'QQ Plot',1,header=TRUE)
a <- table.element(a,hyperlink( paste('https://supernova.wessa.net/rwasp_fitdistrnorm.wasp?convertgetintopost=1&data=',paste(as.character(mysum$resid),sep='',collapse=' '),sep='') ,'Compute','Click here to examine the Residuals.'),1)
a <- table.row.end(a)
a <- table.row.start(a)
a <-table.element(a,'Kernel Density Plot',1,header=TRUE)
a <- table.element(a,hyperlink( paste('https://supernova.wessa.net/rwasp_density.wasp?convertgetintopost=1&data=',paste(as.character(mysum$resid),sep='',collapse=' '),sep='') ,'Compute','Click here to examine the Residuals.'),1)
a <- table.row.end(a)
a <- table.row.start(a)
a <-table.element(a,'Skewness/Kurtosis Test',1,header=TRUE)
a <- table.element(a,hyperlink( paste('https://supernova.wessa.net/rwasp_skewness_kurtosis.wasp?convertgetintopost=1&data=',paste(as.character(mysum$resid),sep='',collapse=' '),sep='') ,'Compute','Click here to examine the Residuals.'),1)
a <- table.row.end(a)
a <- table.row.start(a)
a <-table.element(a,'Skewness-Kurtosis Plot',1,header=TRUE)
a <- table.element(a,hyperlink( paste('https://supernova.wessa.net/rwasp_skewness_kurtosis_plot.wasp?convertgetintopost=1&data=',paste(as.character(mysum$resid),sep='',collapse=' '),sep='') ,'Compute','Click here to examine the Residuals.'),1)
a <- table.row.end(a)
a <- table.row.start(a)
a <-table.element(a,'Harrell-Davis Plot',1,header=TRUE)
a <- table.element(a,hyperlink( paste('https://supernova.wessa.net/rwasp_harrell_davis.wasp?convertgetintopost=1&data=',paste(as.character(mysum$resid),sep='',collapse=' '),sep='') ,'Compute','Click here to examine the Residuals.'),1)
a <- table.row.end(a)
a <- table.row.start(a)
a <-table.element(a,'Bootstrap Plot -- Central Tendency',1,header=TRUE)
a <- table.element(a,hyperlink( paste('https://supernova.wessa.net/rwasp_bootstrapplot1.wasp?convertgetintopost=1&data=',paste(as.character(mysum$resid),sep='',collapse=' '),sep='') ,'Compute','Click here to examine the Residuals.'),1)
a <- table.row.end(a)
a <- table.row.start(a)
a <-table.element(a,'Blocked Bootstrap Plot -- Central Tendency',1,header=TRUE)
a <- table.element(a,hyperlink( paste('https://supernova.wessa.net/rwasp_bootstrapplot.wasp?convertgetintopost=1&data=',paste(as.character(mysum$resid),sep='',collapse=' '),sep='') ,'Compute','Click here to examine the Residuals.'),1)
a <- table.row.end(a)
a <- table.row.start(a)
a <-table.element(a,'(Partial) Autocorrelation Plot',1,header=TRUE)
a <- table.element(a,hyperlink( paste('https://supernova.wessa.net/rwasp_autocorrelation.wasp?convertgetintopost=1&data=',paste(as.character(mysum$resid),sep='',collapse=' '),sep='') ,'Compute','Click here to examine the Residuals.'),1)
a <- table.row.end(a)
a <- table.row.start(a)
a <-table.element(a,'Spectral Analysis',1,header=TRUE)
a <- table.element(a,hyperlink( paste('https://supernova.wessa.net/rwasp_spectrum.wasp?convertgetintopost=1&data=',paste(as.character(mysum$resid),sep='',collapse=' '),sep='') ,'Compute','Click here to examine the Residuals.'),1)
a <- table.row.end(a)
a <- table.row.start(a)
a <-table.element(a,'Tukey lambda PPCC Plot',1,header=TRUE)
a <- table.element(a,hyperlink( paste('https://supernova.wessa.net/rwasp_tukeylambda.wasp?convertgetintopost=1&data=',paste(as.character(mysum$resid),sep='',collapse=' '),sep='') ,'Compute','Click here to examine the Residuals.'),1)
a <- table.row.end(a)
a <- table.row.start(a)
a <-table.element(a,'Box-Cox Normality Plot',1,header=TRUE)
a <- table.element(a,hyperlink( paste('https://supernova.wessa.net/rwasp_boxcoxnorm.wasp?convertgetintopost=1&data=',paste(as.character(mysum$resid),sep='',collapse=' '),sep='') ,'Compute','Click here to examine the Residuals.'),1)
a <- table.row.end(a)
a <- table.row.start(a)
a <- table.element(a,'Summary Statistics',1,header=TRUE)
a <- table.element(a,hyperlink( paste('https://supernova.wessa.net/rwasp_summary1.wasp?convertgetintopost=1&data=',paste(as.character(mysum$resid),sep='',collapse=' '),sep='') ,'Compute','Click here to examine the Residuals.'),1)
a <- table.row.end(a)
a<-table.end(a)
table.save(a,file='mytable7.tab')
if(n < 200) {
a<-table.start()
a<-table.row.start(a)
a<-table.element(a, 'Multiple Linear Regression - Actuals, Interpolation, and Residuals', 4, TRUE)
a<-table.row.end(a)
a<-table.row.start(a)
a<-table.element(a, 'Time or Index', 1, TRUE)
a<-table.element(a, 'Actuals', 1, TRUE)
a<-table.element(a, 'Interpolation
Forecast', 1, TRUE)
a<-table.element(a, 'Residuals
Prediction Error', 1, TRUE)
a<-table.row.end(a)
for (i in 1:n) {
a<-table.row.start(a)
a<-table.element(a,i, 1, TRUE)
a<-table.element(a,formatC(signif(x[i],6),format='g',flag=' '))
a<-table.element(a,formatC(signif(x[i]-mysum$resid[i],6),format='g',flag=' '))
a<-table.element(a,formatC(signif(mysum$resid[i],6),format='g',flag=' '))
a<-table.row.end(a)
}
a<-table.end(a)
table.save(a,file='mytable4.tab')
if (n > n25) {
a<-table.start()
a<-table.row.start(a)
a<-table.element(a,'Goldfeld-Quandt test for Heteroskedasticity',4,TRUE)
a<-table.row.end(a)
a<-table.row.start(a)
a<-table.element(a,'p-values',header=TRUE)
a<-table.element(a,'Alternative Hypothesis',3,header=TRUE)
a<-table.row.end(a)
a<-table.row.start(a)
a<-table.element(a,'breakpoint index',header=TRUE)
a<-table.element(a,'greater',header=TRUE)
a<-table.element(a,'2-sided',header=TRUE)
a<-table.element(a,'less',header=TRUE)
a<-table.row.end(a)
for (mypoint in kp3:nmkm3) {
a<-table.row.start(a)
a<-table.element(a,mypoint,header=TRUE)
a<-table.element(a,formatC(signif(gqarr[mypoint-kp3+1,1],6),format='g',flag=' '))
a<-table.element(a,formatC(signif(gqarr[mypoint-kp3+1,2],6),format='g',flag=' '))
a<-table.element(a,formatC(signif(gqarr[mypoint-kp3+1,3],6),format='g',flag=' '))
a<-table.row.end(a)
}
a<-table.end(a)
table.save(a,file='mytable5.tab')
a<-table.start()
a<-table.row.start(a)
a<-table.element(a,'Meta Analysis of Goldfeld-Quandt test for Heteroskedasticity',4,TRUE)
a<-table.row.end(a)
a<-table.row.start(a)
a<-table.element(a,'Description',header=TRUE)
a<-table.element(a,'# significant tests',header=TRUE)
a<-table.element(a,'% significant tests',header=TRUE)
a<-table.element(a,'OK/NOK',header=TRUE)
a<-table.row.end(a)
a<-table.row.start(a)
a<-table.element(a,'1% type I error level',header=TRUE)
a<-table.element(a,signif(numsignificant1,6))
a<-table.element(a,formatC(signif(numsignificant1/numgqtests,6),format='g',flag=' '))
if (numsignificant1/numgqtests < 0.01) dum <- 'OK' else dum <- 'NOK'
a<-table.element(a,dum)
a<-table.row.end(a)
a<-table.row.start(a)
a<-table.element(a,'5% type I error level',header=TRUE)
a<-table.element(a,signif(numsignificant5,6))
a<-table.element(a,signif(numsignificant5/numgqtests,6))
if (numsignificant5/numgqtests < 0.05) dum <- 'OK' else dum <- 'NOK'
a<-table.element(a,dum)
a<-table.row.end(a)
a<-table.row.start(a)
a<-table.element(a,'10% type I error level',header=TRUE)
a<-table.element(a,signif(numsignificant10,6))
a<-table.element(a,signif(numsignificant10/numgqtests,6))
if (numsignificant10/numgqtests < 0.1) dum <- 'OK' else dum <- 'NOK'
a<-table.element(a,dum)
a<-table.row.end(a)
a<-table.end(a)
table.save(a,file='mytable6.tab')
}
}
a<-table.start()
a<-table.row.start(a)
a<-table.element(a,'Ramsey RESET F-Test for powers (2 and 3) of fitted values',1,TRUE)
a<-table.row.end(a)
a<-table.row.start(a)
reset_test_fitted <- resettest(mylm,power=2:3,type='fitted')
a<-table.element(a,paste('
',RC.texteval('reset_test_fitted'),'
',sep=''))
a<-table.row.end(a)
a<-table.row.start(a)
a<-table.element(a,'Ramsey RESET F-Test for powers (2 and 3) of regressors',1,TRUE)
a<-table.row.end(a)
a<-table.row.start(a)
reset_test_regressors <- resettest(mylm,power=2:3,type='regressor')
a<-table.element(a,paste('
',RC.texteval('reset_test_regressors'),'
',sep=''))
a<-table.row.end(a)
a<-table.row.start(a)
a<-table.element(a,'Ramsey RESET F-Test for powers (2 and 3) of principal components',1,TRUE)
a<-table.row.end(a)
a<-table.row.start(a)
reset_test_principal_components <- resettest(mylm,power=2:3,type='princomp')
a<-table.element(a,paste('
',RC.texteval('reset_test_principal_components'),'
',sep=''))
a<-table.row.end(a)
a<-table.end(a)
table.save(a,file='mytable8.tab')
a<-table.start()
a<-table.row.start(a)
a<-table.element(a,'Variance Inflation Factors (Multicollinearity)',1,TRUE)
a<-table.row.end(a)
a<-table.row.start(a)
vif <- vif(mylm)
a<-table.element(a,paste('
',RC.texteval('vif'),'
',sep=''))
a<-table.row.end(a)
a<-table.end(a)
table.save(a,file='mytable9.tab')