| Multiple Linear Regression - Estimated Regression Equation |
| Score[t] = -258.613 -45.4581Geslacht[t] -5.1149X1[t] -0.476887X2[t] + 3.38782X3[t] -3.28597X4[t] + 164.222X5[t] -24.7568X6[t] + 13.378Inter[t] -0.0605754t + e[t] |
| Multiple Linear Regression - Ordinary Least Squares | |||||
| Variable | Parameter | S.D. | T-STAT H0: parameter = 0 | 2-tail p-value | 1-tail p-value |
| (Intercept) | -258.6 | 60.27 | -4.2910e+00 | 0.001583 | 0.0007916 |
| Geslacht | -45.46 | 26.18 | -1.7370e+00 | 0.1131 | 0.05655 |
| X1 | -5.115 | 2.362 | -2.1650e+00 | 0.0556 | 0.0278 |
| X2 | -0.4769 | 2.071 | -2.3020e-01 | 0.8226 | 0.4113 |
| X3 | +3.388 | 2.757 | +1.2290e+00 | 0.2472 | 0.1236 |
| X4 | -3.286 | 2.449 | -1.3420e+00 | 0.2094 | 0.1047 |
| X5 | +164.2 | 38.39 | +4.2780e+00 | 0.001617 | 0.0008085 |
| X6 | -24.76 | 6.065 | -4.0820e+00 | 0.002207 | 0.001104 |
| Inter | +13.38 | 7.676 | +1.7430e+00 | 0.112 | 0.05598 |
| t | -0.06057 | 0.1767 | -3.4280e-01 | 0.7388 | 0.3694 |
| Multiple Linear Regression - Regression Statistics | |
| Multiple R | 0.8493 |
| R-squared | 0.7214 |
| Adjusted R-squared | 0.4706 |
| F-TEST (value) | 2.876 |
| F-TEST (DF numerator) | 9 |
| F-TEST (DF denominator) | 10 |
| p-value | 0.05761 |
| Multiple Linear Regression - Residual Statistics | |
| Residual Standard Deviation | 3.652 |
| Sum Squared Residuals | 133.3 |
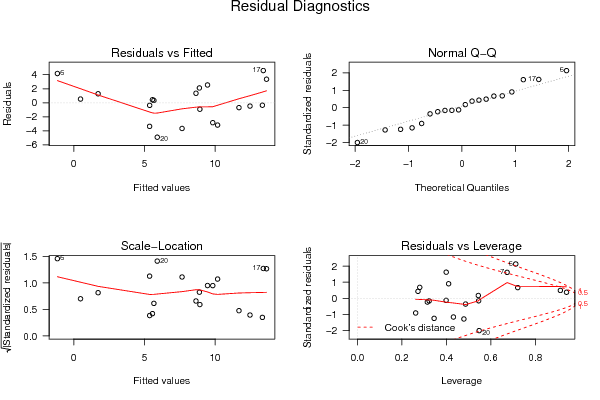
| Menu of Residual Diagnostics | |
| Description | Link |
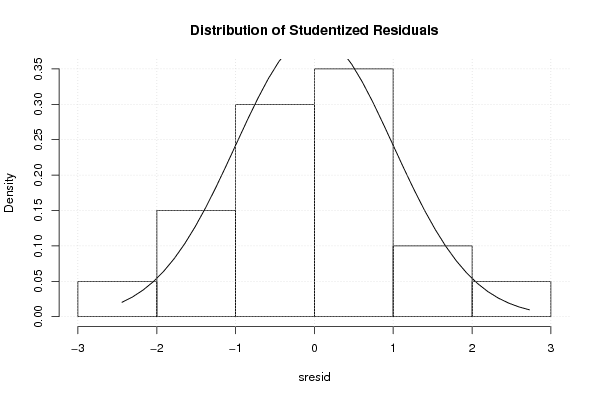
| Histogram | Compute |
| Central Tendency | Compute |
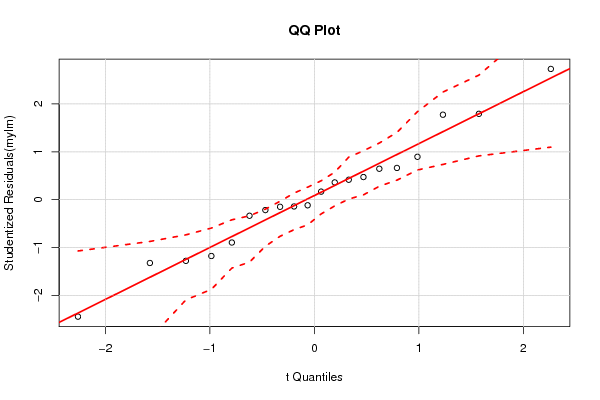
| QQ Plot | Compute |
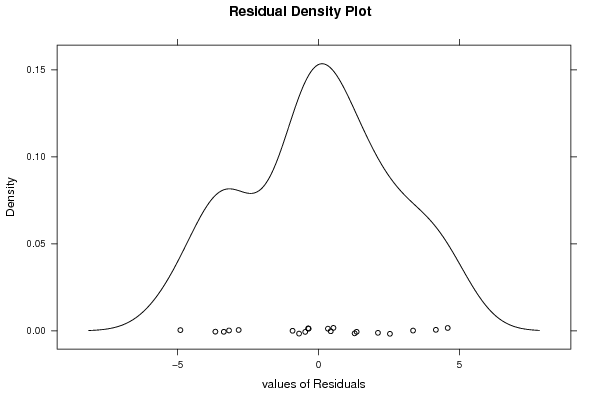
| Kernel Density Plot | Compute |
| Skewness/Kurtosis Test | Compute |
| Skewness-Kurtosis Plot | Compute |
| Harrell-Davis Plot | Compute |
| Bootstrap Plot -- Central Tendency | Compute |
| Blocked Bootstrap Plot -- Central Tendency | Compute |
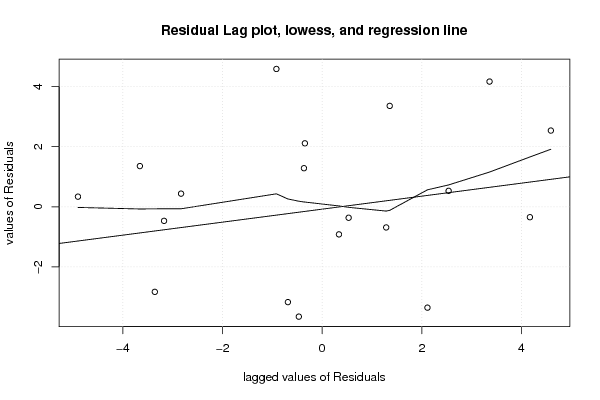
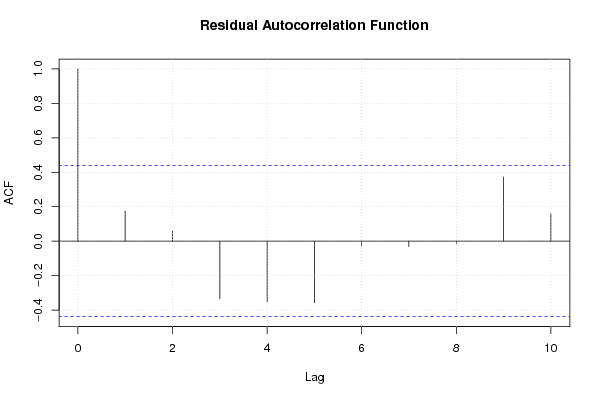
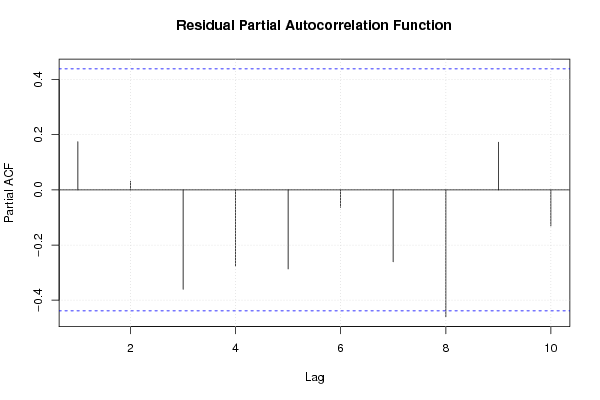
| (Partial) Autocorrelation Plot | Compute |
| Spectral Analysis | Compute |
| Tukey lambda PPCC Plot | Compute |
| Box-Cox Normality Plot | Compute |
| Summary Statistics | Compute |
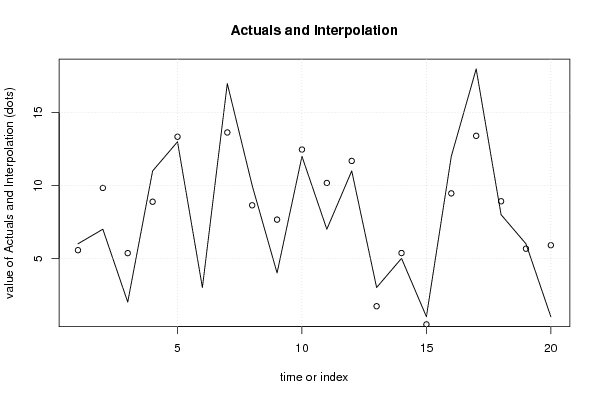
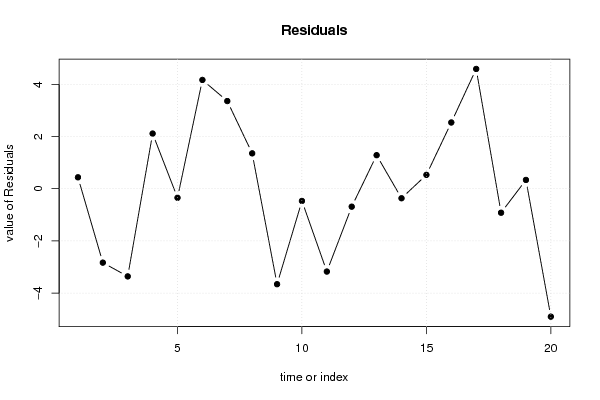
| Multiple Linear Regression - Actuals, Interpolation, and Residuals | |||
| Time or Index | Actuals | Interpolation Forecast | Residuals Prediction Error |
| 1 | 6 | 5.563 | 0.4374 |
| 2 | 7 | 9.833 | -2.833 |
| 3 | 2 | 5.36 | -3.36 |
| 4 | 11 | 8.887 | 2.113 |
| 5 | 13 | 13.35 | -0.3471 |
| 6 | 3 | -1.17 | 4.17 |
| 7 | 17 | 13.64 | 3.36 |
| 8 | 10 | 8.644 | 1.356 |
| 9 | 4 | 7.659 | -3.659 |
| 10 | 12 | 12.47 | -0.4692 |
| 11 | 7 | 10.17 | -3.175 |
| 12 | 11 | 11.69 | -0.688 |
| 13 | 3 | 1.715 | 1.285 |
| 14 | 5 | 5.366 | -0.3657 |
| 15 | 1 | 0.4684 | 0.5316 |
| 16 | 12 | 9.462 | 2.538 |
| 17 | 18 | 13.41 | 4.59 |
| 18 | 8 | 8.919 | -0.9192 |
| 19 | 6 | 5.663 | 0.3366 |
| 20 | 1 | 5.903 | -4.903 |
| Ramsey RESET F-Test for powers (2 and 3) of fitted values |
> reset_test_fitted RESET test data: mylm RESET = 20.949, df1 = 2, df2 = 8, p-value = 0.0006607 |
| Ramsey RESET F-Test for powers (2 and 3) of regressors |
> reset_test_regressors RESET test data: mylm RESET = -2.7725, df1 = 18, df2 = -8, p-value = NA |
| Ramsey RESET F-Test for powers (2 and 3) of principal components |
> reset_test_principal_components RESET test data: mylm RESET = 0.44581, df1 = 2, df2 = 8, p-value = 0.6553 |
| Variance Inflation Factors (Multicollinearity) |
> vif
  Geslacht         X1         X2         X3         X4         X5         X6
256.925944   1.757433   1.608889   2.137092   2.047155 319.624807 372.299138
     Inter          t
278.145286   1.556942
|