| Multiple Linear Regression - Estimated Regression Equation |
| Score[t] = -18.5497 + 26.8632Geslacht[t] -3.30059X1[t] -0.366062X2[t] -2.28864X3[t] + 0.655718X4[t] + 8.40242X5[t] -8.06469Inter[t] -0.0132473t + e[t] |
| Multiple Linear Regression - Ordinary Least Squares | |||||
| Variable | Parameter | S.D. | T-STAT H0: parameter = 0 | 2-tail p-value | 1-tail p-value |
| (Intercept) | -18.55 | 20.5 | -9.0470e-01 | 0.385 | 0.1925 |
| Geslacht | +26.86 | 30 | +8.9540e-01 | 0.3897 | 0.1949 |
| X1 | -3.301 | 3.612 | -9.1380e-01 | 0.3804 | 0.1902 |
| X2 | -0.3661 | 3.225 | -1.1350e-01 | 0.9117 | 0.4558 |
| X3 | -2.289 | 3.706 | -6.1760e-01 | 0.5494 | 0.2747 |
| X4 | +0.6557 | 3.505 | +1.8710e-01 | 0.855 | 0.4275 |
| X5 | +8.402 | 6.351 | +1.3230e+00 | 0.2127 | 0.1063 |
| Inter | -8.065 | 8.714 | -9.2550e-01 | 0.3746 | 0.1873 |
| t | -0.01325 | 0.2745 | -4.8260e-02 | 0.9624 | 0.4812 |
| Multiple Linear Regression - Regression Statistics | |
| Multiple R | 0.507 |
| R-squared | 0.2571 |
| Adjusted R-squared | -0.2833 |
| F-TEST (value) | 0.4757 |
| F-TEST (DF numerator) | 8 |
| F-TEST (DF denominator) | 11 |
| p-value | 0.8495 |
| Multiple Linear Regression - Residual Statistics | |
| Residual Standard Deviation | 5.685 |
| Sum Squared Residuals | 355.5 |
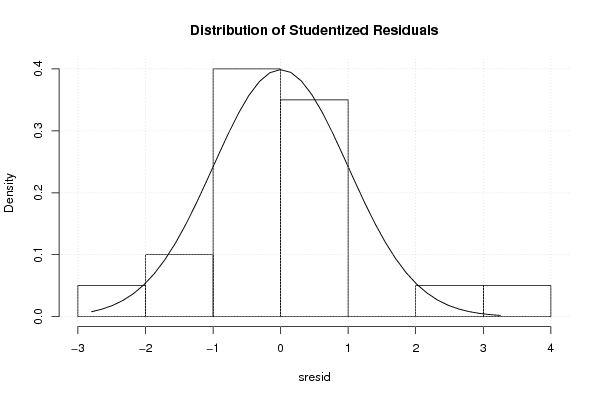
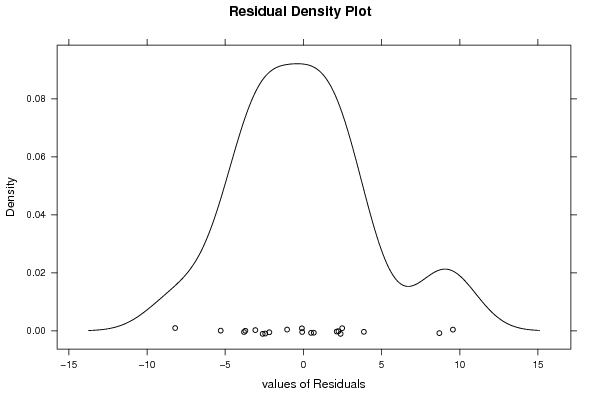
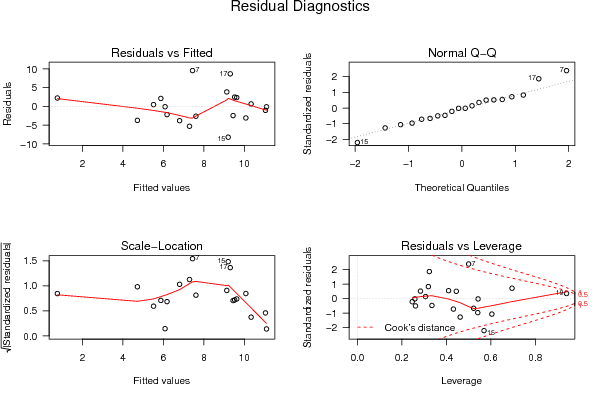
| Menu of Residual Diagnostics | |
| Description | Link |
| Histogram | Compute |
| Central Tendency | Compute |
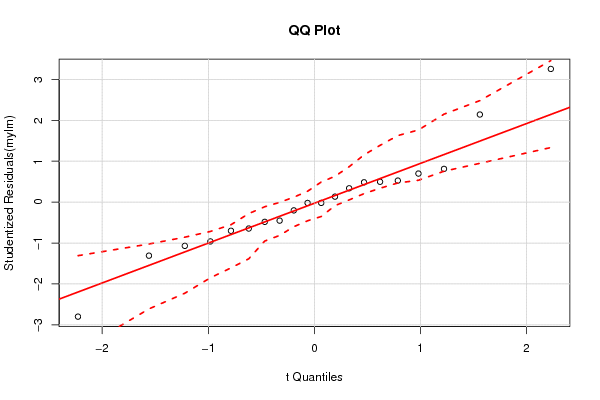
| QQ Plot | Compute |
| Kernel Density Plot | Compute |
| Skewness/Kurtosis Test | Compute |
| Skewness-Kurtosis Plot | Compute |
| Harrell-Davis Plot | Compute |
| Bootstrap Plot -- Central Tendency | Compute |
| Blocked Bootstrap Plot -- Central Tendency | Compute |
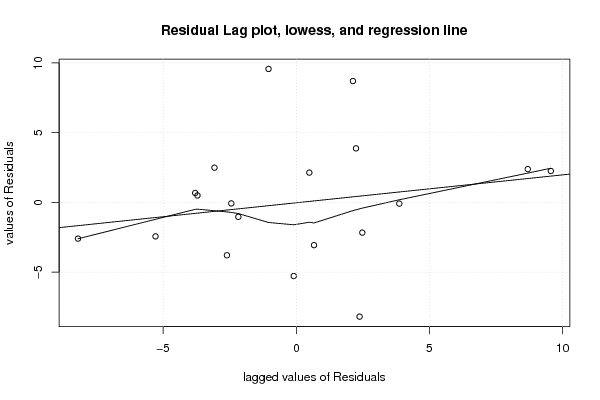
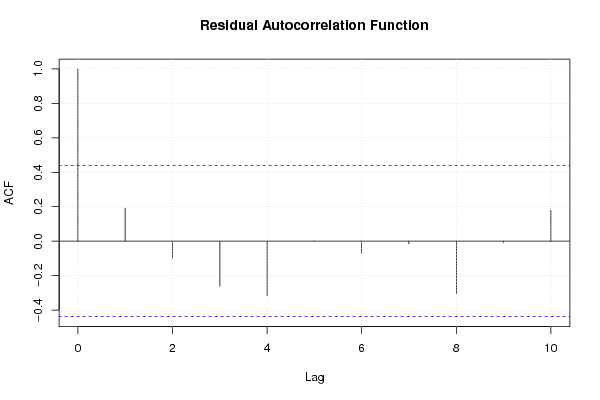
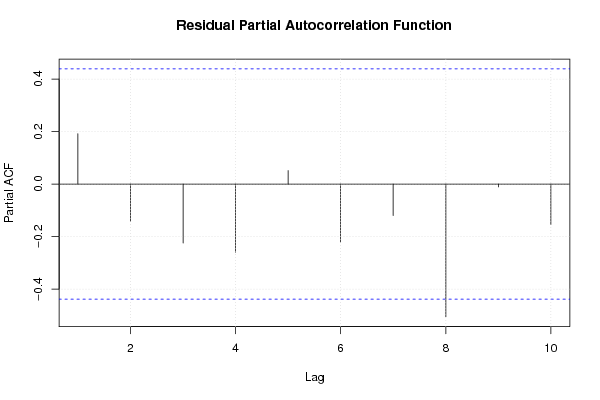
| (Partial) Autocorrelation Plot | Compute |
| Spectral Analysis | Compute |
| Tukey lambda PPCC Plot | Compute |
| Box-Cox Normality Plot | Compute |
| Summary Statistics | Compute |
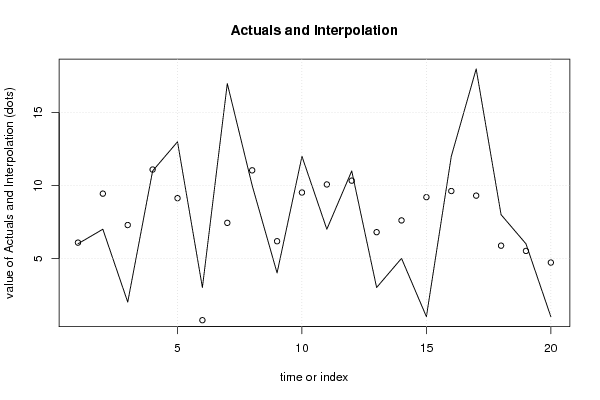
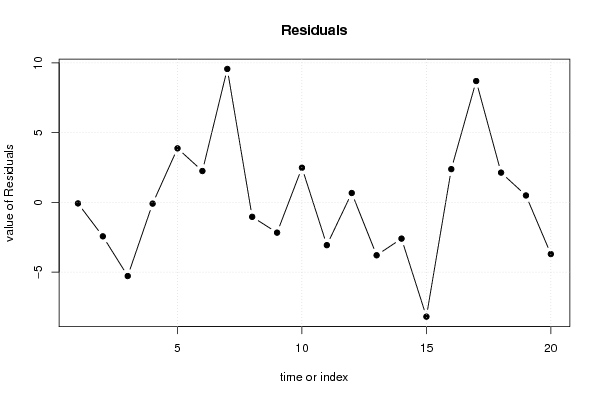
| Multiple Linear Regression - Actuals, Interpolation, and Residuals | |||
| Time or Index | Actuals | Interpolation Forecast | Residuals Prediction Error |
| 1 | 6 | 6.08 | -0.0804 |
| 2 | 7 | 9.441 | -2.441 |
| 3 | 2 | 7.288 | -5.288 |
| 4 | 11 | 11.1 | -0.09542 |
| 5 | 13 | 9.131 | 3.869 |
| 6 | 3 | 0.7568 | 2.243 |
| 7 | 17 | 7.438 | 9.562 |
| 8 | 10 | 11.04 | -1.042 |
| 9 | 4 | 6.177 | -2.177 |
| 10 | 12 | 9.52 | 2.48 |
| 11 | 7 | 10.07 | -3.073 |
| 12 | 11 | 10.33 | 0.6663 |
| 13 | 3 | 6.798 | -3.798 |
| 14 | 5 | 7.605 | -2.605 |
| 15 | 1 | 9.201 | -8.201 |
| 16 | 12 | 9.622 | 2.378 |
| 17 | 18 | 9.304 | 8.696 |
| 18 | 8 | 5.871 | 2.129 |
| 19 | 6 | 5.51 | 0.4903 |
| 20 | 1 | 4.712 | -3.712 |
| Ramsey RESET F-Test for powers (2 and 3) of fitted values |
> reset_test_fitted RESET test data: mylm RESET = 0.31712, df1 = 2, df2 = 9, p-value = 0.7361 |
| Ramsey RESET F-Test for powers (2 and 3) of regressors |
> reset_test_regressors RESET test data: mylm RESET = -0.99218, df1 = 16, df2 = -5, p-value = NA |
| Ramsey RESET F-Test for powers (2 and 3) of principal components |
> reset_test_principal_components RESET test data: mylm RESET = 0.33307, df1 = 2, df2 = 9, p-value = 0.7252 |
| Variance Inflation Factors (Multicollinearity) |
> vif
  Geslacht         X1         X2         X3         X4         X5      Inter
139.227412   1.695211   1.608612   1.593273   1.728995   3.609059 147.881535
         t
  1.550238
|