| Multiple Linear Regression - Estimated Regression Equation |
| Score[t] = -203.2 -4.73753X1[t] -0.660434X2[t] -0.018252X3[t] -2.12243X4[t] + 123.456X5[t] -17.637X6[t] + 0.0958393Inter[t] + e[t] |
| Multiple Linear Regression - Ordinary Least Squares | |||||
| Variable | Parameter | S.D. | T-STAT H0: parameter = 0 | 2-tail p-value | 1-tail p-value |
| (Intercept) | -203.2 | 53.21 | -3.8190e+00 | 0.002445 | 0.001223 |
| X1 | -4.737 | 2.341 | -2.0240e+00 | 0.06587 | 0.03293 |
| X2 | -0.6604 | 1.991 | -3.3160e-01 | 0.7459 | 0.3729 |
| X3 | -0.01825 | 2.025 | -9.0130e-03 | 0.993 | 0.4965 |
| X4 | -2.122 | 2.255 | -9.4120e-01 | 0.3652 | 0.1826 |
| X5 | +123.5 | 31.68 | +3.8970e+00 | 0.002123 | 0.001062 |
| X6 | -17.64 | 4.653 | -3.7900e+00 | 0.002575 | 0.001288 |
| Inter | +0.09584 | 0.5256 | +1.8230e-01 | 0.8584 | 0.4292 |
| Multiple Linear Regression - Regression Statistics | |
| Multiple R | 0.7979 |
| R-squared | 0.6367 |
| Adjusted R-squared | 0.4248 |
| F-TEST (value) | 3.004 |
| F-TEST (DF numerator) | 7 |
| F-TEST (DF denominator) | 12 |
| p-value | 0.04548 |
| Multiple Linear Regression - Residual Statistics | |
| Residual Standard Deviation | 3.806 |
| Sum Squared Residuals | 173.9 |
| Menu of Residual Diagnostics | |
| Description | Link |
| Histogram | Compute |
| Central Tendency | Compute |
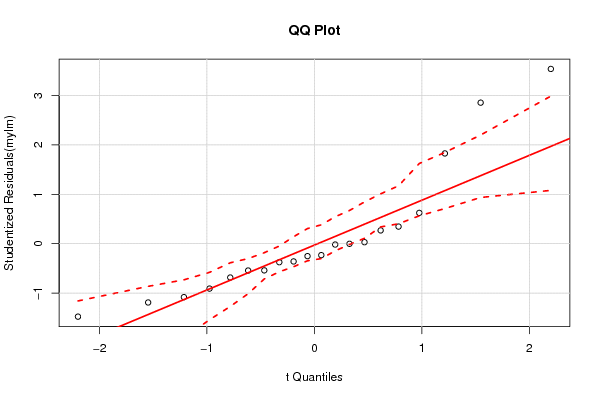
| QQ Plot | Compute |
| Kernel Density Plot | Compute |
| Skewness/Kurtosis Test | Compute |
| Skewness-Kurtosis Plot | Compute |
| Harrell-Davis Plot | Compute |
| Bootstrap Plot -- Central Tendency | Compute |
| Blocked Bootstrap Plot -- Central Tendency | Compute |
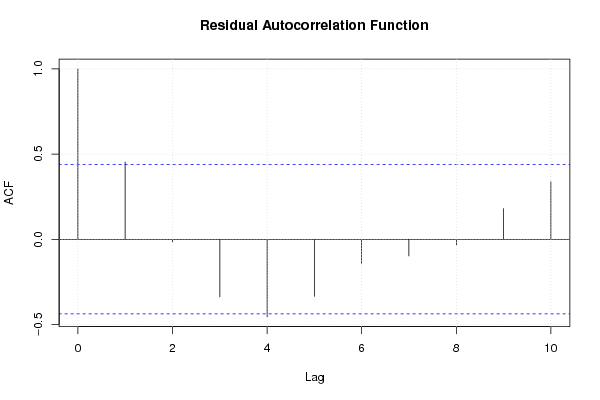
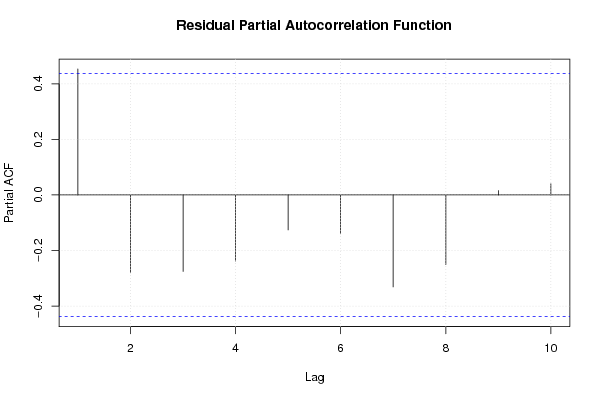
| (Partial) Autocorrelation Plot | Compute |
| Spectral Analysis | Compute |
| Tukey lambda PPCC Plot | Compute |
| Box-Cox Normality Plot | Compute |
| Summary Statistics | Compute |
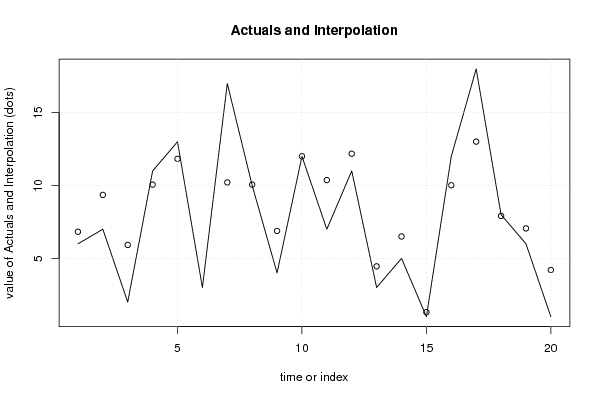
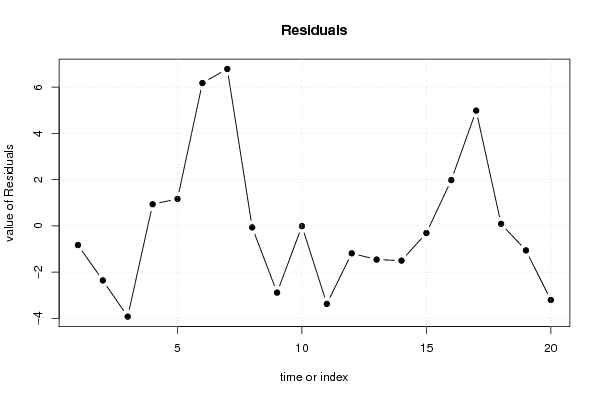
| Multiple Linear Regression - Actuals, Interpolation, and Residuals | |||
| Time or Index | Actuals | Interpolation Forecast | Residuals Prediction Error |
| 1 | 6 | 6.827 | -0.8268 |
| 2 | 7 | 9.356 | -2.356 |
| 3 | 2 | 5.923 | -3.923 |
| 4 | 11 | 10.06 | 0.9387 |
| 5 | 13 | 11.83 | 1.168 |
| 6 | 3 | -3.179 | 6.179 |
| 7 | 17 | 10.21 | 6.789 |
| 8 | 10 | 10.06 | -0.06127 |
| 9 | 4 | 6.883 | -2.883 |
| 10 | 12 | 12.01 | -0.007609 |
| 11 | 7 | 10.37 | -3.37 |
| 12 | 11 | 12.18 | -1.184 |
| 13 | 3 | 4.454 | -1.454 |
| 14 | 5 | 6.5 | -1.5 |
| 15 | 1 | 1.306 | -0.3059 |
| 16 | 12 | 10.02 | 1.983 |
| 17 | 18 | 13.01 | 4.987 |
| 18 | 8 | 7.912 | 0.08828 |
| 19 | 6 | 7.058 | -1.058 |
| 20 | 1 | 4.204 | -3.204 |
| Ramsey RESET F-Test for powers (2 and 3) of fitted values |
> reset_test_fitted RESET test data: mylm RESET = 7.1357, df1 = 2, df2 = 10, p-value = 0.01187 |
| Ramsey RESET F-Test for powers (2 and 3) of regressors |
> reset_test_regressors RESET test data: mylm RESET = -0.61668, df1 = 14, df2 = -2, p-value = NA |
| Ramsey RESET F-Test for powers (2 and 3) of principal components |
> reset_test_principal_components RESET test data: mylm RESET = 1.2902, df1 = 2, df2 = 10, p-value = 0.3174 |
| Variance Inflation Factors (Multicollinearity) |
> vif
        X1         X2         X3         X4         X5         X6      Inter
  1.588847   1.368582   1.061520   1.596918 200.374005 201.713687   1.200382
|