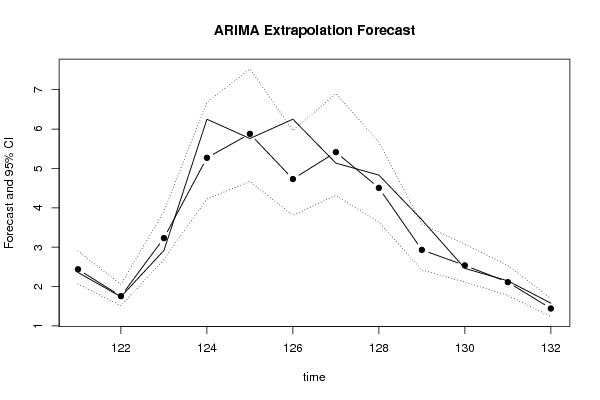
| Univariate ARIMA Extrapolation Forecast | ||||||||
| time | Y[t] | F[t] | 95% LB | 95% UB | p-value (H0: Y[t] = F[t]) | P(F[t]>Y[t-1]) | P(F[t]>Y[t-s]) | P(F[t]>Y[120]) |
| 108 | 1.169 | - | - | - | - | - | - | - |
| 109 | 2.429 | - | - | - | - | - | - | - |
| 110 | 1.762 | - | - | - | - | - | - | - |
| 111 | 2.846 | - | - | - | - | - | - | - |
| 112 | 5.627 | - | - | - | - | - | - | - |
| 113 | 5.749 | - | - | - | - | - | - | - |
| 114 | 4.502 | - | - | - | - | - | - | - |
| 115 | 5.72 | - | - | - | - | - | - | - |
| 116 | 4.403 | - | - | - | - | - | - | - |
| 117 | 2.867 | - | - | - | - | - | - | - |
| 118 | 2.635 | - | - | - | - | - | - | - |
| 119 | 2.059 | - | - | - | - | - | - | - |
| 120 | 1.511 | - | - | - | - | - | - | - |
| 121 | 2.359 | 2.4383 | 2.0671 | 2.9009 | 0.3685 | 1 | 0.5157 | 1 |
| 122 | 1.741 | 1.7575 | 1.512 | 2.0575 | 0.4571 | 0 | 0.4882 | 0.9464 |
| 123 | 2.917 | 3.2312 | 2.6979 | 3.9099 | 0.1821 | 1 | 0.867 | 1 |
| 124 | 6.249 | 5.27 | 4.2225 | 6.682 | 0.0871 | 0.9995 | 0.3101 | 1 |
| 125 | 5.76 | 5.8783 | 4.6705 | 7.5256 | 0.4441 | 0.3296 | 0.5611 | 1 |
| 126 | 6.25 | 4.7302 | 3.8094 | 5.9628 | 0.0078 | 0.0508 | 0.6417 | 1 |
| 127 | 5.134 | 5.4128 | 4.3153 | 6.9025 | 0.3569 | 0.1353 | 0.343 | 1 |
| 128 | 4.831 | 4.5059 | 3.6332 | 5.6719 | 0.2924 | 0.1455 | 0.5686 | 1 |
| 129 | 3.695 | 2.9316 | 2.4238 | 3.5868 | 0.0112 | 0 | 0.5766 | 1 |
| 130 | 2.462 | 2.5375 | 2.1143 | 3.0777 | 0.3921 | 0 | 0.3617 | 0.9999 |
| 131 | 2.146 | 2.1122 | 1.7766 | 2.535 | 0.4377 | 0.0524 | 0.5973 | 0.9973 |
| 132 | 1.579 | 1.4434 | 1.2364 | 1.6978 | 0.1481 | 0 | 0.3013 | 0.3013 |
| Univariate ARIMA Extrapolation Forecast Performance | |||||||||
| time | % S.E. | PE | MAPE | sMAPE | Sq.E | MSE | RMSE | ScaledE | MASE |
| 121 | 0.0968 | -0.0336 | 0.0336 | 0.033 | 0.0063 | 0 | 0 | -0.0809 | 0.0809 |
| 122 | 0.0871 | -0.0095 | 0.0215 | 0.0212 | 3e-04 | 0.0033 | 0.0572 | -0.0168 | 0.0489 |
| 123 | 0.1072 | -0.1077 | 0.0503 | 0.0482 | 0.0987 | 0.0351 | 0.1873 | -0.3207 | 0.1395 |
| 124 | 0.1367 | 0.1567 | 0.0769 | 0.0787 | 0.9584 | 0.2659 | 0.5157 | 0.9993 | 0.3544 |
| 125 | 0.143 | -0.0205 | 0.0656 | 0.067 | 0.014 | 0.2155 | 0.4643 | -0.1207 | 0.3077 |
| 126 | 0.1329 | 0.2432 | 0.0952 | 0.102 | 2.3097 | 0.5645 | 0.7514 | 1.5513 | 0.515 |
| 127 | 0.1404 | -0.0543 | 0.0893 | 0.0949 | 0.0777 | 0.495 | 0.7036 | -0.2846 | 0.4821 |
| 128 | 0.132 | 0.0673 | 0.0866 | 0.0918 | 0.1057 | 0.4463 | 0.6681 | 0.3319 | 0.4633 |
| 129 | 0.114 | 0.2066 | 0.0999 | 0.1072 | 0.5828 | 0.4615 | 0.6793 | 0.7793 | 0.4984 |
| 130 | 0.1086 | -0.0307 | 0.093 | 0.0995 | 0.0057 | 0.4159 | 0.6449 | -0.077 | 0.4563 |
| 131 | 0.1021 | 0.0158 | 0.086 | 0.0919 | 0.0011 | 0.3782 | 0.615 | 0.0345 | 0.4179 |
| 132 | 0.0899 | 0.0859 | 0.086 | 0.0917 | 0.0184 | 0.3482 | 0.5901 | 0.1384 | 0.3946 |