| Multiple Linear Regression - Estimated Regression Equation |
| TVDC[t] = + 6.17113 + 0.654382SKEOU1[t] + 1.21091SKEOU2[t] -0.0176858SKEOU3[t] + 0.489403SKEOU4[t] + 0.156109SKEOU5[t] -0.0646882SKEOU6[t] -0.0029188t + e[t] |
| Multiple Linear Regression - Ordinary Least Squares | |||||
| Variable | Parameter | S.D. | T-STAT H0: parameter = 0 | 2-tail p-value | 1-tail p-value |
| (Intercept) | +6.171 | 2.159 | +2.8580e+00 | 0.00525 | 0.002625 |
| SKEOU1 | +0.6544 | 0.2154 | +3.0380e+00 | 0.003083 | 0.001541 |
| SKEOU2 | +1.211 | 0.239 | +5.0670e+00 | 2.017e-06 | 1.008e-06 |
| SKEOU3 | -0.01769 | 0.2043 | -8.6580e-02 | 0.9312 | 0.4656 |
| SKEOU4 | +0.4894 | 0.2881 | +1.6980e+00 | 0.09272 | 0.04636 |
| SKEOU5 | +0.1561 | 0.2416 | +6.4620e-01 | 0.5197 | 0.2598 |
| SKEOU6 | -0.06469 | 0.2606 | -2.4830e-01 | 0.8045 | 0.4022 |
| t | -0.002919 | 0.005257 | -5.5520e-01 | 0.5801 | 0.29 |
| Multiple Linear Regression - Regression Statistics | |
| Multiple R | 0.6161 |
| R-squared | 0.3796 |
| Adjusted R-squared | 0.3334 |
| F-TEST (value) | 8.217 |
| F-TEST (DF numerator) | 7 |
| F-TEST (DF denominator) | 94 |
| p-value | 8.693e-08 |
| Multiple Linear Regression - Residual Statistics | |
| Residual Standard Deviation | 1.531 |
| Sum Squared Residuals | 220.5 |
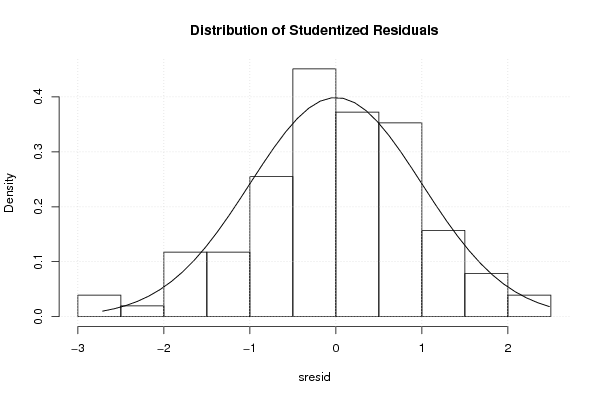
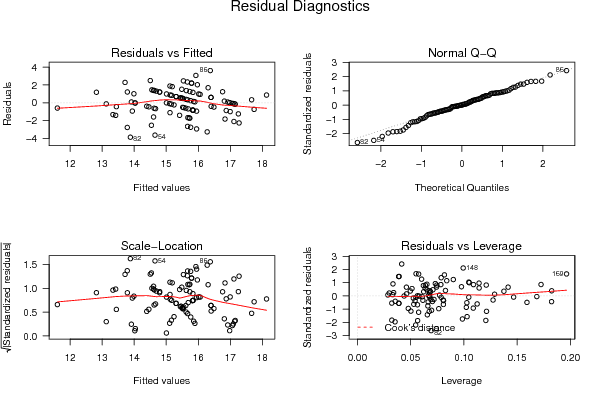
| Menu of Residual Diagnostics | |
| Description | Link |
| Histogram | Compute |
| Central Tendency | Compute |
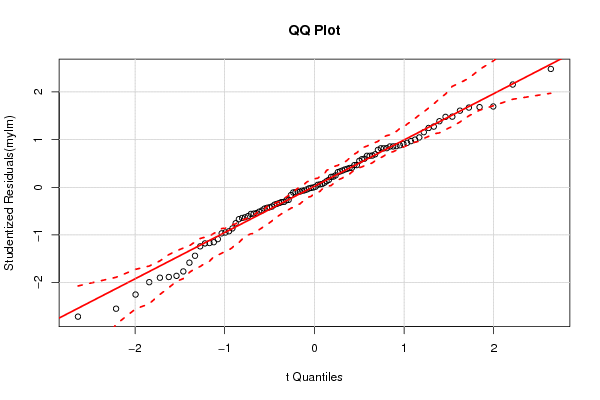
| QQ Plot | Compute |
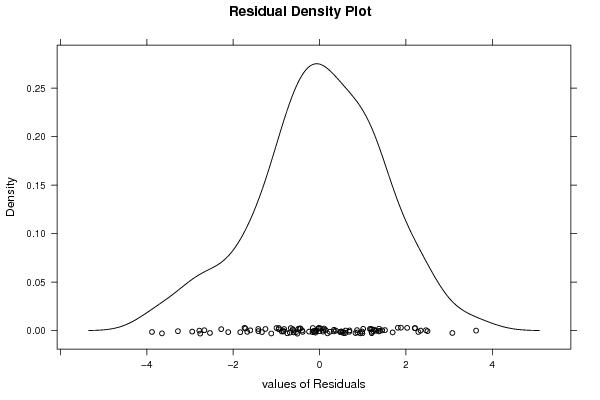
| Kernel Density Plot | Compute |
| Skewness/Kurtosis Test | Compute |
| Skewness-Kurtosis Plot | Compute |
| Harrell-Davis Plot | Compute |
| Bootstrap Plot -- Central Tendency | Compute |
| Blocked Bootstrap Plot -- Central Tendency | Compute |
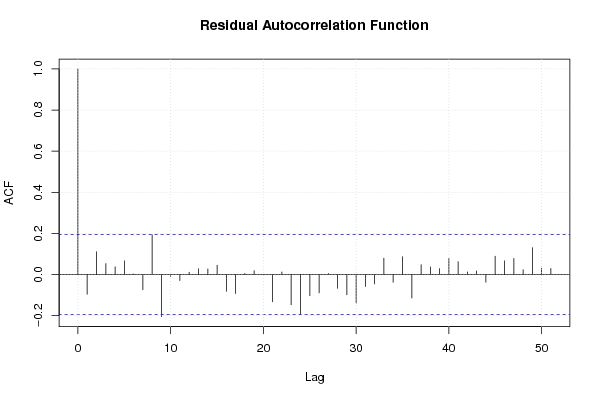
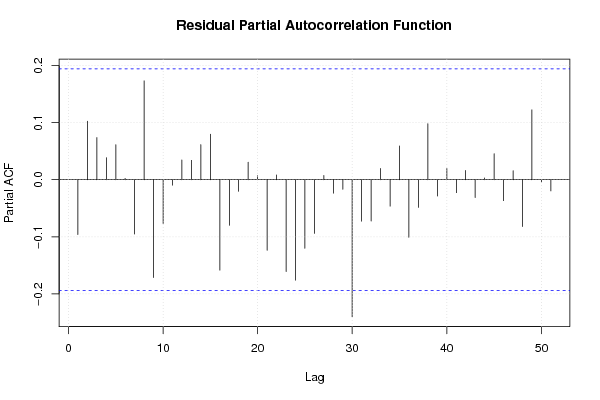
| (Partial) Autocorrelation Plot | Compute |
| Spectral Analysis | Compute |
| Tukey lambda PPCC Plot | Compute |
| Box-Cox Normality Plot | Compute |
| Summary Statistics | Compute |
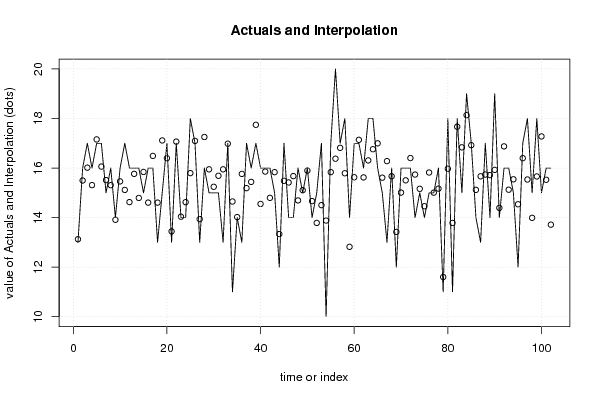
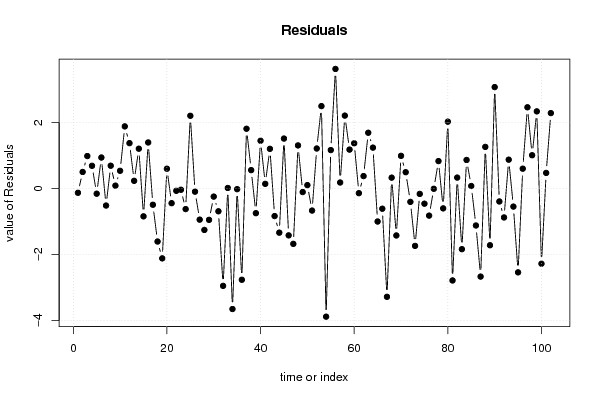
| Multiple Linear Regression - Actuals, Interpolation, and Residuals | |||
| Time or Index | Actuals | Interpolation Forecast | Residuals Prediction Error |
| 1 | 13 | 13.13 | -0.1268 |
| 2 | 16 | 15.5 | 0.5037 |
| 3 | 17 | 16.01 | 0.9855 |
| 4 | 16 | 15.31 | 0.6898 |
| 5 | 17 | 17.15 | -0.1549 |
| 6 | 17 | 16.06 | 0.9412 |
| 7 | 15 | 15.51 | -0.5134 |
| 8 | 16 | 15.31 | 0.6926 |
| 9 | 14 | 13.91 | 0.08909 |
| 10 | 16 | 15.46 | 0.5389 |
| 11 | 17 | 15.12 | 1.884 |
| 12 | 16 | 14.62 | 1.376 |
| 13 | 16 | 15.76 | 0.2355 |
| 14 | 16 | 14.79 | 1.208 |
| 15 | 15 | 15.84 | -0.8411 |
| 16 | 16 | 14.6 | 1.397 |
| 17 | 16 | 16.49 | -0.4896 |
| 18 | 13 | 14.6 | -1.604 |
| 19 | 15 | 17.11 | -2.114 |
| 20 | 17 | 16.4 | 0.6015 |
| 21 | 13 | 13.44 | -0.4423 |
| 22 | 17 | 17.07 | -0.0669 |
| 23 | 14 | 14.04 | -0.03502 |
| 24 | 14 | 14.62 | -0.6216 |
| 25 | 18 | 15.79 | 2.206 |
| 26 | 17 | 17.09 | -0.09359 |
| 27 | 13 | 13.94 | -0.9407 |
| 28 | 16 | 17.25 | -1.253 |
| 29 | 15 | 15.95 | -0.9475 |
| 30 | 15 | 15.24 | -0.2432 |
| 31 | 15 | 15.69 | -0.6877 |
| 32 | 13 | 15.95 | -2.948 |
| 33 | 17 | 16.98 | 0.01826 |
| 34 | 11 | 14.65 | -3.648 |
| 35 | 14 | 14.02 | -0.01768 |
| 36 | 13 | 15.76 | -2.762 |
| 37 | 17 | 15.19 | 1.813 |
| 38 | 16 | 15.44 | 0.5594 |
| 39 | 17 | 17.75 | -0.7454 |
| 40 | 16 | 14.55 | 1.449 |
| 41 | 16 | 15.86 | 0.1434 |
| 42 | 16 | 14.8 | 1.204 |
| 43 | 15 | 15.83 | -0.8331 |
| 44 | 12 | 13.33 | -1.335 |
| 45 | 17 | 15.48 | 1.515 |
| 46 | 14 | 15.42 | -1.417 |
| 47 | 14 | 15.67 | -1.674 |
| 48 | 16 | 14.69 | 1.308 |
| 49 | 15 | 15.11 | -0.1051 |
| 50 | 16 | 15.89 | 0.105 |
| 51 | 14 | 14.67 | -0.6659 |
| 52 | 15 | 13.79 | 1.215 |
| 53 | 17 | 14.5 | 2.498 |
| 54 | 10 | 13.88 | -3.88 |
| 55 | 17 | 15.83 | 1.167 |
| 56 | 20 | 16.38 | 3.624 |
| 57 | 17 | 16.82 | 0.1848 |
| 58 | 18 | 15.79 | 2.211 |
| 59 | 14 | 12.82 | 1.181 |
| 60 | 17 | 15.63 | 1.373 |
| 61 | 17 | 17.14 | -0.1385 |
| 62 | 16 | 15.62 | 0.3785 |
| 63 | 18 | 16.31 | 1.692 |
| 64 | 18 | 16.76 | 1.241 |
| 65 | 16 | 17 | -0.9974 |
| 66 | 15 | 15.61 | -0.6098 |
| 67 | 13 | 16.28 | -3.279 |
| 68 | 16 | 15.67 | 0.3313 |
| 69 | 12 | 13.42 | -1.42 |
| 70 | 16 | 15.01 | 0.9915 |
| 71 | 16 | 15.5 | 0.4962 |
| 72 | 16 | 16.4 | -0.4028 |
| 73 | 14 | 15.74 | -1.736 |
| 74 | 15 | 15.16 | -0.1618 |
| 75 | 14 | 14.46 | -0.4575 |
| 76 | 15 | 15.82 | -0.8191 |
| 77 | 15 | 15.01 | -0.005707 |
| 78 | 16 | 15.17 | 0.8322 |
| 79 | 11 | 11.6 | -0.5993 |
| 80 | 18 | 15.97 | 2.028 |
| 81 | 11 | 13.78 | -2.783 |
| 82 | 18 | 17.67 | 0.3331 |
| 83 | 15 | 16.84 | -1.836 |
| 84 | 19 | 18.13 | 0.8672 |
| 85 | 17 | 16.92 | 0.07862 |
| 86 | 14 | 15.12 | -1.118 |
| 87 | 13 | 15.67 | -2.666 |
| 88 | 17 | 15.74 | 1.263 |
| 89 | 14 | 15.72 | -1.716 |
| 90 | 19 | 15.93 | 3.074 |
| 91 | 14 | 14.39 | -0.3906 |
| 92 | 16 | 16.87 | -0.8742 |
| 93 | 16 | 15.12 | 0.876 |
| 94 | 15 | 15.55 | -0.5458 |
| 95 | 12 | 14.54 | -2.538 |
| 96 | 17 | 16.4 | 0.6026 |
| 97 | 18 | 15.54 | 2.463 |
| 98 | 15 | 13.99 | 1.01 |
| 99 | 18 | 15.66 | 2.339 |
| 100 | 15 | 17.28 | -2.276 |
| 101 | 16 | 15.53 | 0.4747 |
| 102 | 16 | 13.71 | 2.287 |
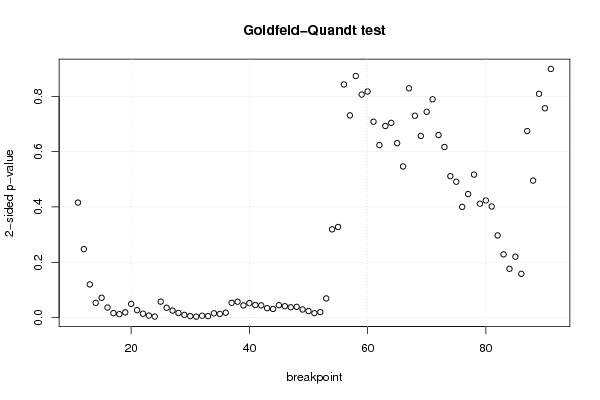
| Goldfeld-Quandt test for Heteroskedasticity | |||
| p-values | Alternative Hypothesis | ||
| breakpoint index | greater | 2-sided | less |
| 11 | 0.2079 | 0.4158 | 0.7921 |
| 12 | 0.1238 | 0.2476 | 0.8762 |
| 13 | 0.05998 | 0.12 | 0.94 |
| 14 | 0.02666 | 0.05332 | 0.9733 |
| 15 | 0.03582 | 0.07165 | 0.9642 |
| 16 | 0.01816 | 0.03633 | 0.9818 |
| 17 | 0.008131 | 0.01626 | 0.9919 |
| 18 | 0.006119 | 0.01224 | 0.9939 |
| 19 | 0.009484 | 0.01897 | 0.9905 |
| 20 | 0.02475 | 0.04949 | 0.9753 |
| 21 | 0.01341 | 0.02683 | 0.9866 |
| 22 | 0.007029 | 0.01406 | 0.993 |
| 23 | 0.003603 | 0.007207 | 0.9964 |
| 24 | 0.001778 | 0.003557 | 0.9982 |
| 25 | 0.02884 | 0.05768 | 0.9712 |
| 26 | 0.01777 | 0.03555 | 0.9822 |
| 27 | 0.01265 | 0.0253 | 0.9874 |
| 28 | 0.008305 | 0.01661 | 0.9917 |
| 29 | 0.004874 | 0.009748 | 0.9951 |
| 30 | 0.002704 | 0.005407 | 0.9973 |
| 31 | 0.001681 | 0.003361 | 0.9983 |
| 32 | 0.003388 | 0.006776 | 0.9966 |
| 33 | 0.002671 | 0.005342 | 0.9973 |
| 34 | 0.007776 | 0.01555 | 0.9922 |
| 35 | 0.006585 | 0.01317 | 0.9934 |
| 36 | 0.008867 | 0.01773 | 0.9911 |
| 37 | 0.02664 | 0.05329 | 0.9734 |
| 38 | 0.02873 | 0.05747 | 0.9713 |
| 39 | 0.02197 | 0.04394 | 0.978 |
| 40 | 0.02619 | 0.05239 | 0.9738 |
| 41 | 0.02264 | 0.04528 | 0.9774 |
| 42 | 0.02206 | 0.04413 | 0.9779 |
| 43 | 0.01699 | 0.03397 | 0.983 |
| 44 | 0.01563 | 0.03125 | 0.9844 |
| 45 | 0.02253 | 0.04507 | 0.9775 |
| 46 | 0.02053 | 0.04107 | 0.9795 |
| 47 | 0.01864 | 0.03728 | 0.9814 |
| 48 | 0.01942 | 0.03884 | 0.9806 |
| 49 | 0.01469 | 0.02938 | 0.9853 |
| 50 | 0.01178 | 0.02356 | 0.9882 |
| 51 | 0.008007 | 0.01601 | 0.992 |
| 52 | 0.009934 | 0.01987 | 0.9901 |
| 53 | 0.03465 | 0.0693 | 0.9653 |
| 54 | 0.1596 | 0.3191 | 0.8404 |
| 55 | 0.1638 | 0.3276 | 0.8362 |
| 56 | 0.4215 | 0.8429 | 0.5785 |
| 57 | 0.3656 | 0.7312 | 0.6344 |
| 58 | 0.4368 | 0.8736 | 0.5632 |
| 59 | 0.4032 | 0.8065 | 0.5968 |
| 60 | 0.4087 | 0.8174 | 0.5913 |
| 61 | 0.3541 | 0.7082 | 0.6459 |
| 62 | 0.3119 | 0.6237 | 0.6881 |
| 63 | 0.3463 | 0.6926 | 0.6537 |
| 64 | 0.352 | 0.7041 | 0.648 |
| 65 | 0.3153 | 0.6306 | 0.6847 |
| 66 | 0.2733 | 0.5465 | 0.7267 |
| 67 | 0.4145 | 0.8291 | 0.5855 |
| 68 | 0.3649 | 0.7299 | 0.6351 |
| 69 | 0.3284 | 0.6569 | 0.6716 |
| 70 | 0.3721 | 0.7442 | 0.6279 |
| 71 | 0.3948 | 0.7896 | 0.6052 |
| 72 | 0.33 | 0.66 | 0.67 |
| 73 | 0.3084 | 0.6168 | 0.6916 |
| 74 | 0.2556 | 0.5112 | 0.7444 |
| 75 | 0.2456 | 0.4911 | 0.7544 |
| 76 | 0.2001 | 0.4003 | 0.7999 |
| 77 | 0.2233 | 0.4466 | 0.7767 |
| 78 | 0.2586 | 0.5172 | 0.7414 |
| 79 | 0.2058 | 0.4117 | 0.7942 |
| 80 | 0.2118 | 0.4235 | 0.7882 |
| 81 | 0.2009 | 0.4019 | 0.7991 |
| 82 | 0.1486 | 0.2971 | 0.8514 |
| 83 | 0.1143 | 0.2286 | 0.8857 |
| 84 | 0.08816 | 0.1763 | 0.9118 |
| 85 | 0.11 | 0.22 | 0.89 |
| 86 | 0.07917 | 0.1583 | 0.9208 |
| 87 | 0.3373 | 0.6746 | 0.6627 |
| 88 | 0.2477 | 0.4954 | 0.7523 |
| 89 | 0.4045 | 0.809 | 0.5955 |
| 90 | 0.6215 | 0.7569 | 0.3785 |
| 91 | 0.4495 | 0.899 | 0.5505 |
| Meta Analysis of Goldfeld-Quandt test for Heteroskedasticity | |||
| Description | # significant tests | % significant tests | OK/NOK |
| 1% type I error level | 7 | 0.08642 | NOK |
| 5% type I error level | 33 | 0.407407 | NOK |
| 10% type I error level | 40 | 0.493827 | NOK |
| Ramsey RESET F-Test for powers (2 and 3) of fitted values |
> reset_test_fitted RESET test data: mylm RESET = 0.86436, df1 = 2, df2 = 92, p-value = 0.4247 |
| Ramsey RESET F-Test for powers (2 and 3) of regressors |
> reset_test_regressors RESET test data: mylm RESET = 1.1394, df1 = 14, df2 = 80, p-value = 0.3383 |
| Ramsey RESET F-Test for powers (2 and 3) of principal components |
> reset_test_principal_components RESET test data: mylm RESET = 0.63548, df1 = 2, df2 = 92, p-value = 0.532 |
| Variance Inflation Factors (Multicollinearity) |
> vif SKEOU1 SKEOU2 SKEOU3 SKEOU4 SKEOU5 SKEOU6 t 1.079926 1.174041 1.060037 1.074538 1.034518 1.057194 1.042031 |