| Multiple Linear Regression - Estimated Regression Equation |
| Score[t] = -3.79028 -3.02469X1[t] -0.00242463X2[t] -0.39795X3[t] + 0.787451X4[t] + 3.87749X5[t] -0.294381Inter[t] -0.0355305t + e[t] |
| Multiple Linear Regression - Ordinary Least Squares | |||||
| Variable | Parameter | S.D. | T-STAT H0: parameter = 0 | 2-tail p-value | 1-tail p-value |
| (Intercept) | -3.79 | 12.1 | -3.1340e-01 | 0.7594 | 0.3797 |
| X1 | -3.025 | 3.569 | -8.4750e-01 | 0.4133 | 0.2066 |
| X2 | -0.002425 | 3.172 | -7.6430e-04 | 0.9994 | 0.4997 |
| X3 | -0.398 | 3.02 | -1.3180e-01 | 0.8974 | 0.4487 |
| X4 | +0.7874 | 3.473 | +2.2680e-01 | 0.8244 | 0.4122 |
| X5 | +3.877 | 3.815 | +1.0160e+00 | 0.3295 | 0.1648 |
| Inter | -0.2944 | 0.7855 | -3.7480e-01 | 0.7144 | 0.3572 |
| t | -0.03553 | 0.2711 | -1.3110e-01 | 0.8979 | 0.4489 |
| Multiple Linear Regression - Regression Statistics | |
| Multiple R | 0.4504 |
| R-squared | 0.2029 |
| Adjusted R-squared | -0.2621 |
| F-TEST (value) | 0.4364 |
| F-TEST (DF numerator) | 7 |
| F-TEST (DF denominator) | 12 |
| p-value | 0.8612 |
| Multiple Linear Regression - Residual Statistics | |
| Residual Standard Deviation | 5.638 |
| Sum Squared Residuals | 381.5 |
| Menu of Residual Diagnostics | |
| Description | Link |
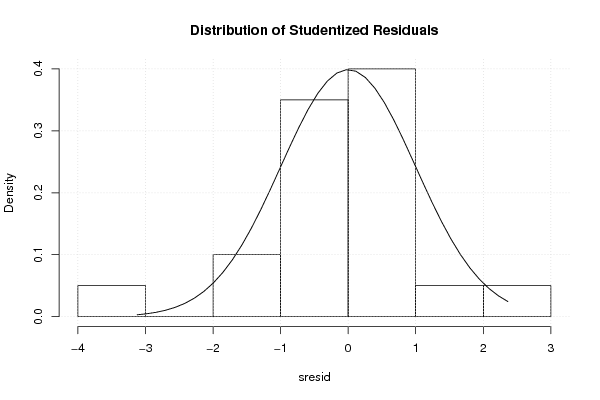
| Histogram | Compute |
| Central Tendency | Compute |
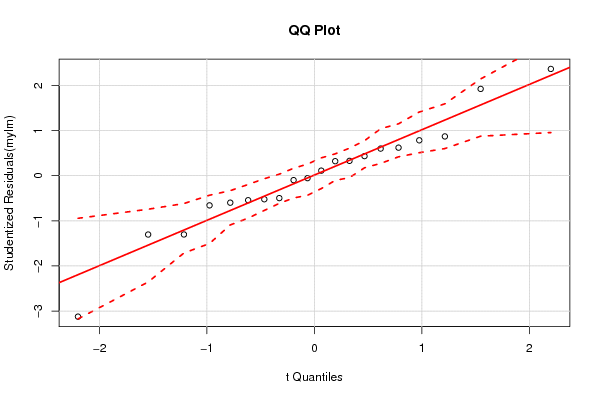
| QQ Plot | Compute |
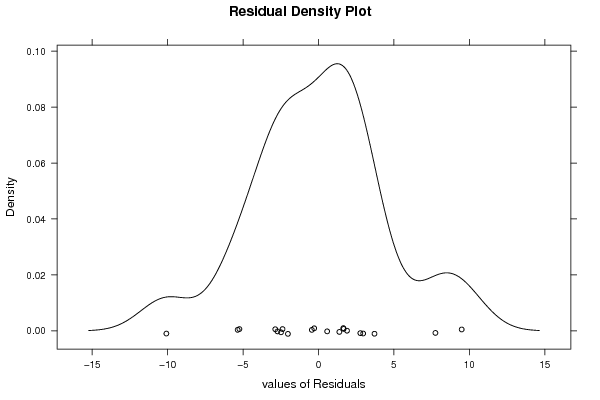
| Kernel Density Plot | Compute |
| Skewness/Kurtosis Test | Compute |
| Skewness-Kurtosis Plot | Compute |
| Harrell-Davis Plot | Compute |
| Bootstrap Plot -- Central Tendency | Compute |
| Blocked Bootstrap Plot -- Central Tendency | Compute |
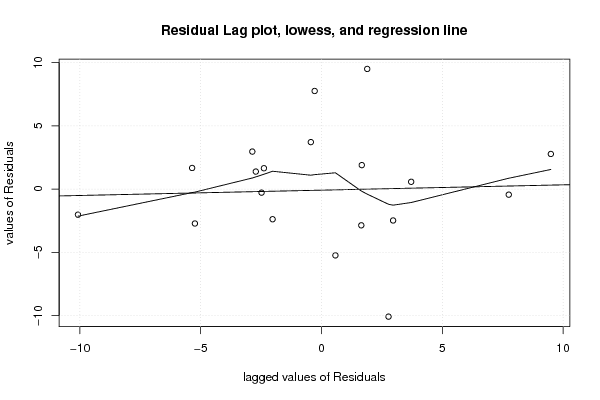
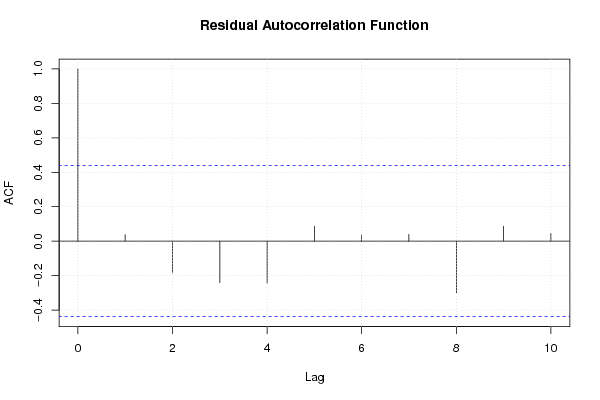
| (Partial) Autocorrelation Plot | Compute |
| Spectral Analysis | Compute |
| Tukey lambda PPCC Plot | Compute |
| Box-Cox Normality Plot | Compute |
| Summary Statistics | Compute |
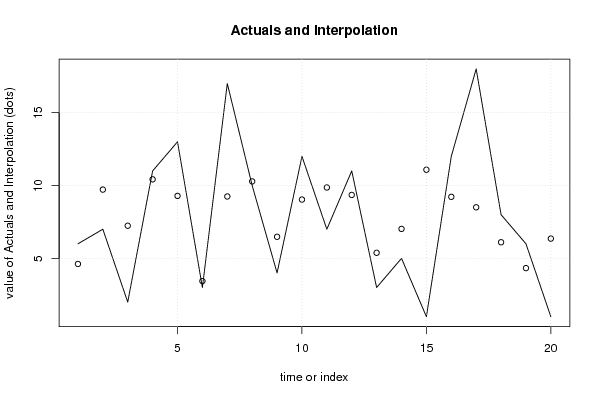
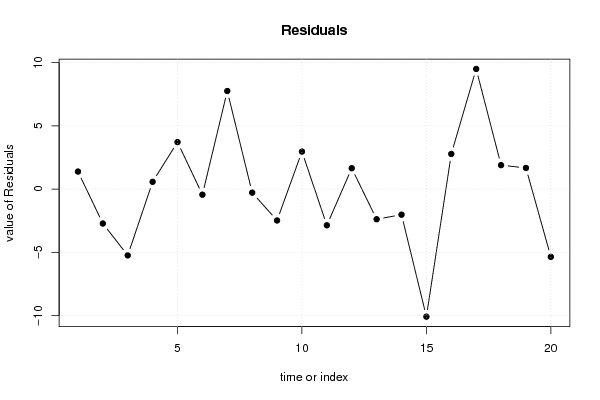
| Multiple Linear Regression - Actuals, Interpolation, and Residuals | |||
| Time or Index | Actuals | Interpolation Forecast | Residuals Prediction Error |
| 1 | 6 | 4.615 | 1.385 |
| 2 | 7 | 9.719 | -2.719 |
| 3 | 2 | 7.24 | -5.24 |
| 4 | 11 | 10.42 | 0.5762 |
| 5 | 13 | 9.287 | 3.713 |
| 6 | 3 | 3.441 | -0.4411 |
| 7 | 17 | 9.247 | 7.753 |
| 8 | 10 | 10.28 | -0.2817 |
| 9 | 4 | 6.481 | -2.481 |
| 10 | 12 | 9.035 | 2.965 |
| 11 | 7 | 9.864 | -2.864 |
| 12 | 11 | 9.352 | 1.648 |
| 13 | 3 | 5.383 | -2.383 |
| 14 | 5 | 7.024 | -2.024 |
| 15 | 1 | 11.08 | -10.08 |
| 16 | 12 | 9.224 | 2.776 |
| 17 | 18 | 8.505 | 9.495 |
| 18 | 8 | 6.106 | 1.893 |
| 19 | 6 | 4.332 | 1.668 |
| 20 | 1 | 6.356 | -5.356 |
| Ramsey RESET F-Test for powers (2 and 3) of fitted values |
> reset_test_fitted RESET test data: mylm RESET = 4.9364, df1 = 2, df2 = 10, p-value = 0.03226 |
| Ramsey RESET F-Test for powers (2 and 3) of regressors |
> reset_test_regressors RESET test data: mylm RESET = -0.35179, df1 = 14, df2 = -2, p-value = NA |
| Ramsey RESET F-Test for powers (2 and 3) of principal components |
> reset_test_principal_components RESET test data: mylm RESET = 0.046094, df1 = 2, df2 = 10, p-value = 0.9552 |
| Variance Inflation Factors (Multicollinearity) |
> vif
      X1       X2       X3       X4       X5    Inter        t
1.682875 1.583100 1.076013 1.725949 1.324195 1.221752 1.537496
|