| Multiple Linear Regression - Estimated Regression Equation |
| bouwvergunningen[t] = + 2341.98 + 24.8243Inflatie[t] + 14.0134Consumentenvertrouwen[t] -0.0185675huwelijken[t] + e[t] |
| Multiple Linear Regression - Ordinary Least Squares | |||||
| Variable | Parameter | S.D. | T-STAT H0: parameter = 0 | 2-tail p-value | 1-tail p-value |
| (Intercept) | +2342 | 130.5 | +1.7940e+01 | 3.512e-34 | 1.756e-34 |
| Inflatie | +24.82 | 27.89 | +8.9000e-01 | 0.3754 | 0.1877 |
| Consumentenvertrouwen | +14.01 | 6.14 | +2.2820e+00 | 0.02442 | 0.01221 |
| huwelijken | -0.01857 | 0.0264 | -7.0340e-01 | 0.4833 | 0.2417 |
| Multiple Linear Regression - Regression Statistics | |
| Multiple R | 0.2482 |
| R-squared | 0.06163 |
| Adjusted R-squared | 0.03556 |
| F-TEST (value) | 2.364 |
| F-TEST (DF numerator) | 3 |
| F-TEST (DF denominator) | 108 |
| p-value | 0.07512 |
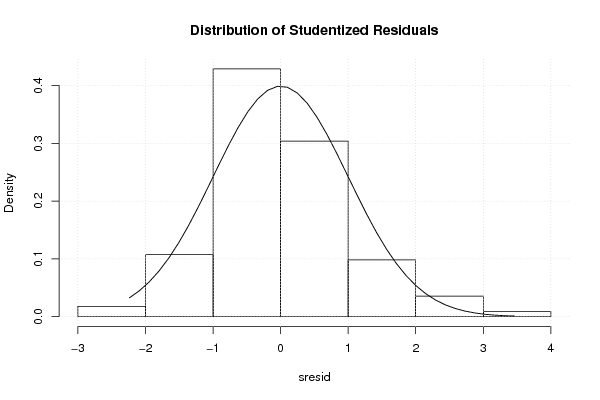
| Multiple Linear Regression - Residual Statistics | |
| Residual Standard Deviation | 459.6 |
| Sum Squared Residuals | 2.281e+07 |
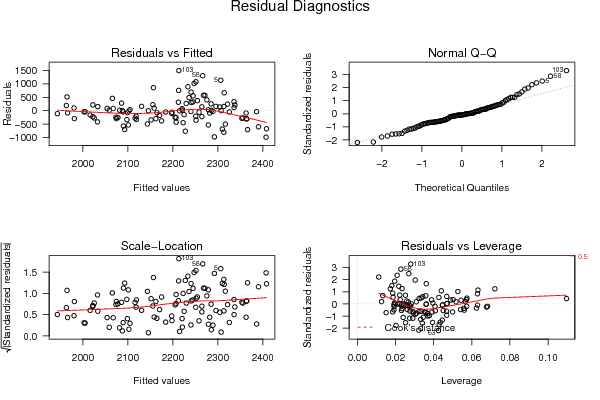
| Menu of Residual Diagnostics | |
| Description | Link |
| Histogram | Compute |
| Central Tendency | Compute |
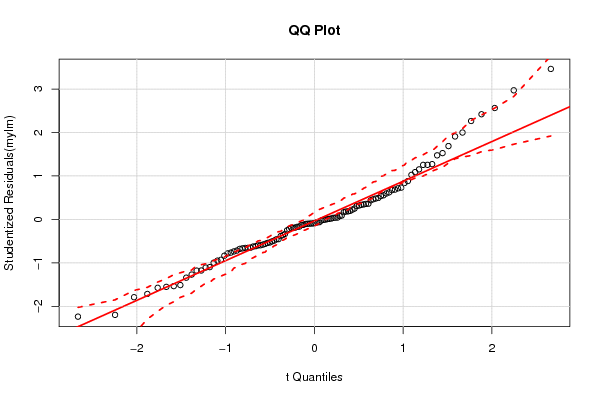
| QQ Plot | Compute |
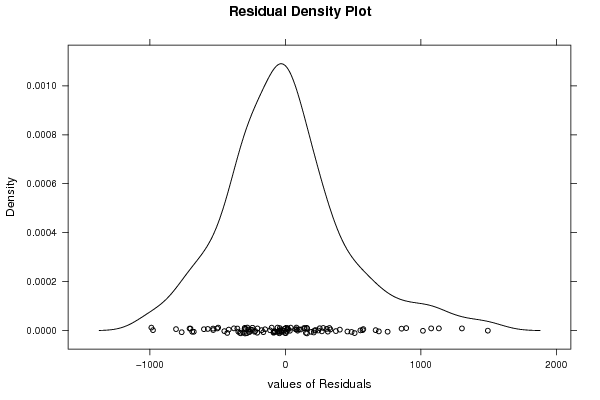
| Kernel Density Plot | Compute |
| Skewness/Kurtosis Test | Compute |
| Skewness-Kurtosis Plot | Compute |
| Harrell-Davis Plot | Compute |
| Bootstrap Plot -- Central Tendency | Compute |
| Blocked Bootstrap Plot -- Central Tendency | Compute |
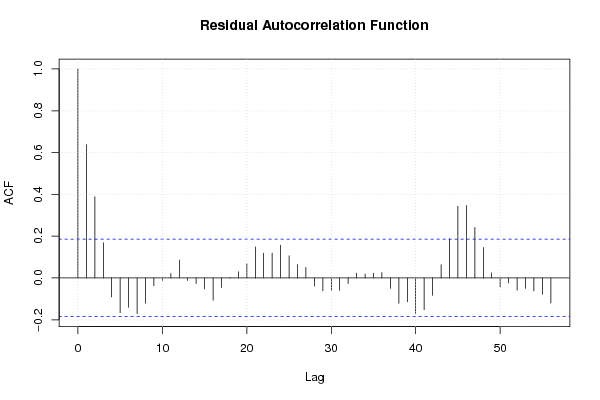
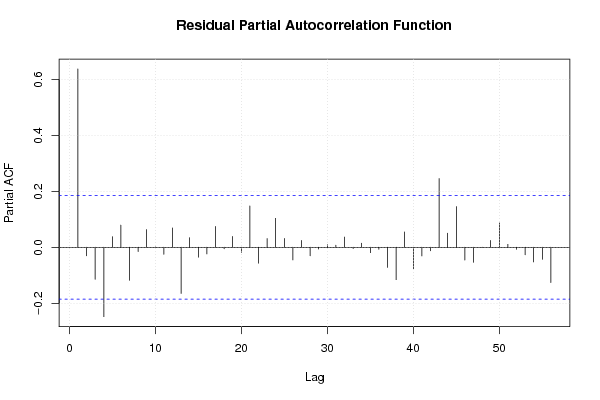
| (Partial) Autocorrelation Plot | Compute |
| Spectral Analysis | Compute |
| Tukey lambda PPCC Plot | Compute |
| Box-Cox Normality Plot | Compute |
| Summary Statistics | Compute |
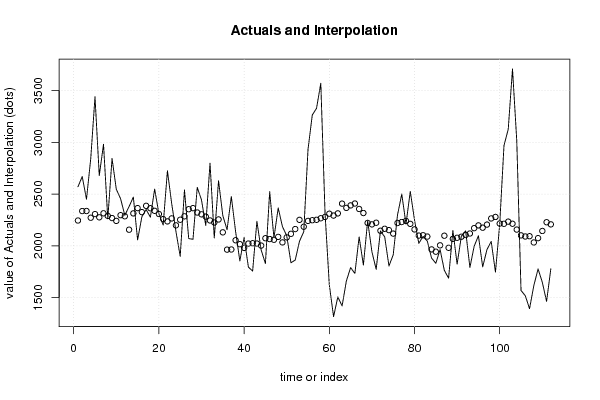
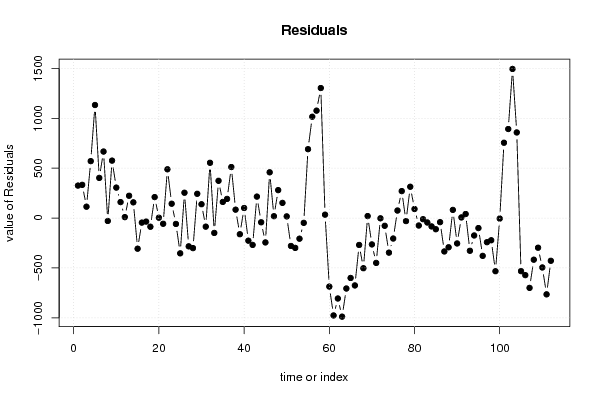
| Multiple Linear Regression - Actuals, Interpolation, and Residuals | |||
| Time or Index | Actuals | Interpolation Forecast | Residuals Prediction Error |
| 1 | 2570 | 2244 | 325.6 |
| 2 | 2669 | 2336 | 333.1 |
| 3 | 2450 | 2336 | 113.9 |
| 4 | 2842 | 2271 | 570.7 |
| 5 | 3440 | 2307 | 1133 |
| 6 | 2678 | 2276 | 402.5 |
| 7 | 2981 | 2314 | 666.8 |
| 8 | 2260 | 2289 | -29.12 |
| 9 | 2844 | 2268 | 575.9 |
| 10 | 2546 | 2241 | 305.4 |
| 11 | 2456 | 2296 | 160.1 |
| 12 | 2295 | 2286 | 9.488 |
| 13 | 2379 | 2155 | 223.6 |
| 14 | 2471 | 2313 | 157.5 |
| 15 | 2057 | 2364 | -307.1 |
| 16 | 2280 | 2326 | -45.57 |
| 17 | 2351 | 2386 | -35.27 |
| 18 | 2276 | 2363 | -86.98 |
| 19 | 2548 | 2338 | 210.2 |
| 20 | 2311 | 2307 | 3.595 |
| 21 | 2201 | 2258 | -57.2 |
| 22 | 2725 | 2236 | 489.1 |
| 23 | 2408 | 2264 | 143.5 |
| 24 | 2139 | 2198 | -59.07 |
| 25 | 1898 | 2252 | -353.6 |
| 26 | 2539 | 2285 | 253.9 |
| 27 | 2070 | 2353 | -283.5 |
| 28 | 2063 | 2364 | -300.9 |
| 29 | 2565 | 2322 | 243.4 |
| 30 | 2443 | 2304 | 138.7 |
| 31 | 2196 | 2282 | -86 |
| 32 | 2799 | 2245 | 554.1 |
| 33 | 2076 | 2225 | -149 |
| 34 | 2628 | 2255 | 373.5 |
| 35 | 2292 | 2130 | 161.7 |
| 36 | 2155 | 1963 | 191.9 |
| 37 | 2476 | 1965 | 511.5 |
| 38 | 2138 | 2054 | 84.26 |
| 39 | 1854 | 2016 | -162 |
| 40 | 2081 | 1980 | 100.9 |
| 41 | 1795 | 2022 | -226.8 |
| 42 | 1756 | 2025 | -269 |
| 43 | 2237 | 2022 | 215 |
| 44 | 1960 | 2002 | -42.3 |
| 45 | 1829 | 2073 | -244.3 |
| 46 | 2524 | 2065 | 458.6 |
| 47 | 2077 | 2058 | 18.5 |
| 48 | 2366 | 2086 | 280.1 |
| 49 | 2185 | 2033 | 152.1 |
| 50 | 2098 | 2081 | 16.71 |
| 51 | 1836 | 2116 | -279.9 |
| 52 | 1863 | 2162 | -299 |
| 53 | 2044 | 2251 | -206.9 |
| 54 | 2136 | 2184 | -48.04 |
| 55 | 2931 | 2240 | 690.5 |
| 56 | 3263 | 2247 | 1016 |
| 57 | 3328 | 2251 | 1077 |
| 58 | 3570 | 2266 | 1304 |
| 59 | 2313 | 2279 | 34 |
| 60 | 1623 | 2310 | -687 |
| 61 | 1316 | 2292 | -976.4 |
| 62 | 1507 | 2313 | -806.4 |
| 63 | 1419 | 2407 | -988.3 |
| 64 | 1660 | 2366 | -706.2 |
| 65 | 1790 | 2390 | -600.5 |
| 66 | 1733 | 2408 | -675.4 |
| 67 | 2086 | 2356 | -269.7 |
| 68 | 1814 | 2317 | -502.7 |
| 69 | 2241 | 2221 | 19.87 |
| 70 | 1943 | 2207 | -264.1 |
| 71 | 1773 | 2223 | -449.8 |
| 72 | 2143 | 2145 | -2.482 |
| 73 | 2087 | 2165 | -77.55 |
| 74 | 1805 | 2152 | -346.6 |
| 75 | 1913 | 2118 | -205.1 |
| 76 | 2296 | 2220 | 75.5 |
| 77 | 2500 | 2230 | 270.3 |
| 78 | 2210 | 2240 | -30.17 |
| 79 | 2526 | 2212 | 313.8 |
| 80 | 2249 | 2158 | 90.61 |
| 81 | 2024 | 2099 | -74.81 |
| 82 | 2091 | 2102 | -11.19 |
| 83 | 2045 | 2089 | -44.36 |
| 84 | 1882 | 1966 | -83.69 |
| 85 | 1831 | 1943 | -112 |
| 86 | 1964 | 2005 | -40.82 |
| 87 | 1763 | 2098 | -334.6 |
| 88 | 1688 | 1981 | -292.8 |
| 89 | 2149 | 2067 | 81.79 |
| 90 | 1823 | 2078 | -254.6 |
| 91 | 2094 | 2088 | 6.364 |
| 92 | 2145 | 2105 | 40.38 |
| 93 | 1791 | 2119 | -328 |
| 94 | 1996 | 2170 | -174.4 |
| 95 | 2097 | 2197 | -100.4 |
| 96 | 1796 | 2175 | -378.9 |
| 97 | 1963 | 2205 | -241.9 |
| 98 | 2042 | 2265 | -222.5 |
| 99 | 1746 | 2279 | -532.9 |
| 100 | 2210 | 2215 | -4.998 |
| 101 | 2968 | 2213 | 755.2 |
| 102 | 3126 | 2233 | 892.6 |
| 103 | 3708 | 2213 | 1495 |
| 104 | 3015 | 2157 | 858.2 |
| 105 | 1569 | 2101 | -532 |
| 106 | 1518 | 2090 | -572 |
| 107 | 1393 | 2093 | -699.8 |
| 108 | 1615 | 2032 | -417.3 |
| 109 | 1777 | 2074 | -297.2 |
| 110 | 1648 | 2143 | -495.4 |
| 111 | 1463 | 2228 | -764.7 |
| 112 | 1779 | 2207 | -428.2 |
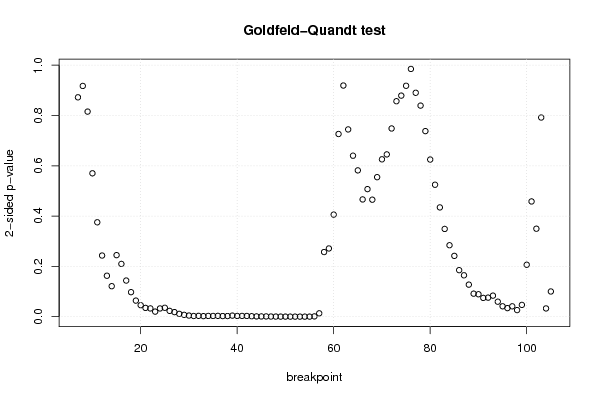
| Goldfeld-Quandt test for Heteroskedasticity | |||
| p-values | Alternative Hypothesis | ||
| breakpoint index | greater | 2-sided | less |
| 7 | 0.4362 | 0.8724 | 0.5638 |
| 8 | 0.4587 | 0.9175 | 0.5413 |
| 9 | 0.4077 | 0.8155 | 0.5923 |
| 10 | 0.2851 | 0.5701 | 0.7149 |
| 11 | 0.1877 | 0.3753 | 0.8123 |
| 12 | 0.1216 | 0.2431 | 0.8784 |
| 13 | 0.08135 | 0.1627 | 0.9187 |
| 14 | 0.0606 | 0.1212 | 0.9394 |
| 15 | 0.1223 | 0.2446 | 0.8777 |
| 16 | 0.1049 | 0.2098 | 0.8951 |
| 17 | 0.07181 | 0.1436 | 0.9282 |
| 18 | 0.04872 | 0.09744 | 0.9513 |
| 19 | 0.03192 | 0.06384 | 0.9681 |
| 20 | 0.02277 | 0.04554 | 0.9772 |
| 21 | 0.01738 | 0.03477 | 0.9826 |
| 22 | 0.01641 | 0.03283 | 0.9836 |
| 23 | 0.009995 | 0.01999 | 0.99 |
| 24 | 0.0163 | 0.0326 | 0.9837 |
| 25 | 0.01767 | 0.03535 | 0.9823 |
| 26 | 0.0115 | 0.023 | 0.9885 |
| 27 | 0.009055 | 0.01811 | 0.9909 |
| 28 | 0.005573 | 0.01115 | 0.9944 |
| 29 | 0.003603 | 0.007205 | 0.9964 |
| 30 | 0.002211 | 0.004422 | 0.9978 |
| 31 | 0.001302 | 0.002604 | 0.9987 |
| 32 | 0.001603 | 0.003207 | 0.9984 |
| 33 | 0.001065 | 0.002129 | 0.9989 |
| 34 | 0.001408 | 0.002816 | 0.9986 |
| 35 | 0.001396 | 0.002793 | 0.9986 |
| 36 | 0.001574 | 0.003147 | 0.9984 |
| 37 | 0.001181 | 0.002362 | 0.9988 |
| 38 | 0.001249 | 0.002497 | 0.9988 |
| 39 | 0.002074 | 0.004149 | 0.9979 |
| 40 | 0.001415 | 0.002831 | 0.9986 |
| 41 | 0.001454 | 0.002908 | 0.9985 |
| 42 | 0.001376 | 0.002752 | 0.9986 |
| 43 | 0.0008708 | 0.001742 | 0.9991 |
| 44 | 0.000547 | 0.001094 | 0.9995 |
| 45 | 0.0004636 | 0.0009271 | 0.9995 |
| 46 | 0.0004468 | 0.0008937 | 0.9996 |
| 47 | 0.0002669 | 0.0005338 | 0.9997 |
| 48 | 0.0001811 | 0.0003622 | 0.9998 |
| 49 | 0.0001074 | 0.0002148 | 0.9999 |
| 50 | 6.13e-05 | 0.0001226 | 0.9999 |
| 51 | 5.19e-05 | 0.0001038 | 0.9999 |
| 52 | 4.542e-05 | 9.084e-05 | 1 |
| 53 | 3.11e-05 | 6.219e-05 | 1 |
| 54 | 1.715e-05 | 3.429e-05 | 1 |
| 55 | 4.674e-05 | 9.347e-05 | 1 |
| 56 | 0.0005818 | 0.001164 | 0.9994 |
| 57 | 0.006645 | 0.01329 | 0.9934 |
| 58 | 0.1285 | 0.257 | 0.8715 |
| 59 | 0.1356 | 0.2712 | 0.8644 |
| 60 | 0.2029 | 0.4058 | 0.7971 |
| 61 | 0.3632 | 0.7264 | 0.6368 |
| 62 | 0.4596 | 0.9192 | 0.5404 |
| 63 | 0.6277 | 0.7446 | 0.3723 |
| 64 | 0.68 | 0.6401 | 0.32 |
| 65 | 0.7091 | 0.5818 | 0.2909 |
| 66 | 0.7669 | 0.4662 | 0.2331 |
| 67 | 0.7464 | 0.5072 | 0.2536 |
| 68 | 0.7674 | 0.4651 | 0.2326 |
| 69 | 0.7227 | 0.5547 | 0.2773 |
| 70 | 0.6871 | 0.6258 | 0.3129 |
| 71 | 0.6774 | 0.6453 | 0.3226 |
| 72 | 0.6258 | 0.7483 | 0.3742 |
| 73 | 0.5716 | 0.8568 | 0.4284 |
| 74 | 0.5605 | 0.8791 | 0.4395 |
| 75 | 0.5409 | 0.9183 | 0.4591 |
| 76 | 0.4926 | 0.9851 | 0.5074 |
| 77 | 0.4452 | 0.8904 | 0.5548 |
| 78 | 0.4197 | 0.8393 | 0.5803 |
| 79 | 0.3689 | 0.7378 | 0.6311 |
| 80 | 0.3124 | 0.6248 | 0.6876 |
| 81 | 0.2623 | 0.5246 | 0.7377 |
| 82 | 0.2173 | 0.4345 | 0.7827 |
| 83 | 0.1745 | 0.3489 | 0.8255 |
| 84 | 0.142 | 0.2841 | 0.858 |
| 85 | 0.1209 | 0.2417 | 0.8791 |
| 86 | 0.09247 | 0.1849 | 0.9075 |
| 87 | 0.08229 | 0.1646 | 0.9177 |
| 88 | 0.06365 | 0.1273 | 0.9364 |
| 89 | 0.04568 | 0.09137 | 0.9543 |
| 90 | 0.04455 | 0.08909 | 0.9555 |
| 91 | 0.03727 | 0.07454 | 0.9627 |
| 92 | 0.03781 | 0.07563 | 0.9622 |
| 93 | 0.0418 | 0.0836 | 0.9582 |
| 94 | 0.02973 | 0.05946 | 0.9703 |
| 95 | 0.02065 | 0.0413 | 0.9794 |
| 96 | 0.01698 | 0.03396 | 0.983 |
| 97 | 0.02056 | 0.04113 | 0.9794 |
| 98 | 0.01311 | 0.02622 | 0.9869 |
| 99 | 0.02338 | 0.04675 | 0.9766 |
| 100 | 0.1032 | 0.2064 | 0.8968 |
| 101 | 0.2291 | 0.4582 | 0.7709 |
| 102 | 0.1749 | 0.3498 | 0.8251 |
| 103 | 0.604 | 0.792 | 0.396 |
| 104 | 0.9836 | 0.03271 | 0.01636 |
| 105 | 0.95 | 0.1001 | 0.05004 |
| Meta Analysis of Goldfeld-Quandt test for Heteroskedasticity | |||
| Description | # significant tests | % significant tests | OK/NOK |
| 1% type I error level | 28 | 0.2828 | NOK |
| 5% type I error level | 44 | 0.444444 | NOK |
| 10% type I error level | 52 | 0.525253 | NOK |
| Ramsey RESET F-Test for powers (2 and 3) of fitted values |
> reset_test_fitted RESET test data: mylm RESET = 11.727, df1 = 2, df2 = 106, p-value = 2.508e-05 |
| Ramsey RESET F-Test for powers (2 and 3) of regressors |
> reset_test_regressors RESET test data: mylm RESET = 1.4496, df1 = 6, df2 = 102, p-value = 0.2032 |
| Ramsey RESET F-Test for powers (2 and 3) of principal components |
> reset_test_principal_components RESET test data: mylm RESET = 0.12727, df1 = 2, df2 = 106, p-value = 0.8806 |
| Variance Inflation Factors (Multicollinearity) |
> vif
             Inflatie Consumentenvertrouwen            huwelijken
             1.014752              1.014508              1.000765
|