| Multiple Linear Regression - Estimated Regression Equation |
| Score[t] = -2.94979 -2.76758X1[t] + 0.201828X2[t] -0.550132X3[t] + 1.14388X4[t] + 3.29425X5[t] + e[t] |
| Multiple Linear Regression - Ordinary Least Squares | |||||
| Variable | Parameter | S.D. | T-STAT H0: parameter = 0 | 2-tail p-value | 1-tail p-value |
| (Intercept) | -2.95 | 10.96 | -2.6910e-01 | 0.7918 | 0.3959 |
| X1 | -2.768 | 3.144 | -8.8020e-01 | 0.3936 | 0.1968 |
| X2 | +0.2018 | 2.728 | +7.3970e-02 | 0.9421 | 0.471 |
| X3 | -0.5501 | 2.776 | -1.9810e-01 | 0.8458 | 0.4229 |
| X4 | +1.144 | 2.869 | +3.9870e-01 | 0.6961 | 0.348 |
| X5 | +3.294 | 3.202 | +1.0290e+00 | 0.321 | 0.1605 |
| Multiple Linear Regression - Regression Statistics | |
| Multiple R | 0.4398 |
| R-squared | 0.1934 |
| Adjusted R-squared | -0.09465 |
| F-TEST (value) | 0.6714 |
| F-TEST (DF numerator) | 5 |
| F-TEST (DF denominator) | 14 |
| p-value | 0.6517 |
| Multiple Linear Regression - Residual Statistics | |
| Residual Standard Deviation | 5.251 |
| Sum Squared Residuals | 386 |
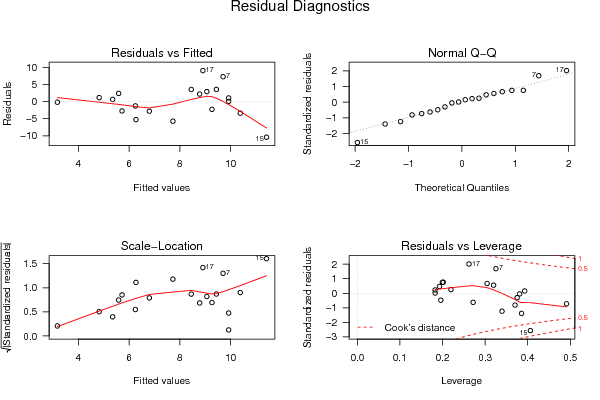
| Menu of Residual Diagnostics | |
| Description | Link |
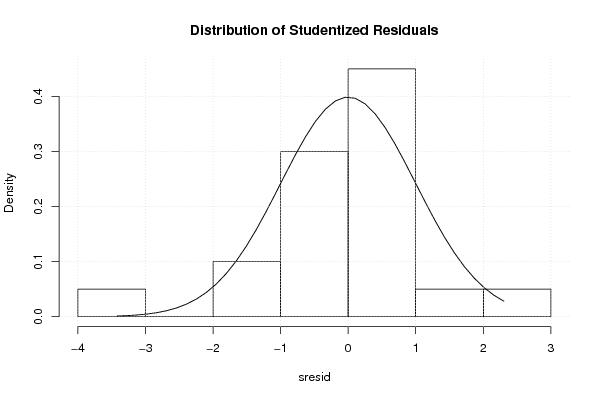
| Histogram | Compute |
| Central Tendency | Compute |
| QQ Plot | Compute |
| Kernel Density Plot | Compute |
| Skewness/Kurtosis Test | Compute |
| Skewness-Kurtosis Plot | Compute |
| Harrell-Davis Plot | Compute |
| Bootstrap Plot -- Central Tendency | Compute |
| Blocked Bootstrap Plot -- Central Tendency | Compute |
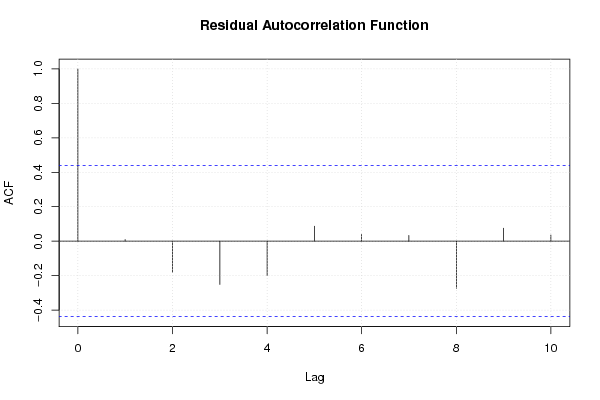
| (Partial) Autocorrelation Plot | Compute |
| Spectral Analysis | Compute |
| Tukey lambda PPCC Plot | Compute |
| Box-Cox Normality Plot | Compute |
| Summary Statistics | Compute |
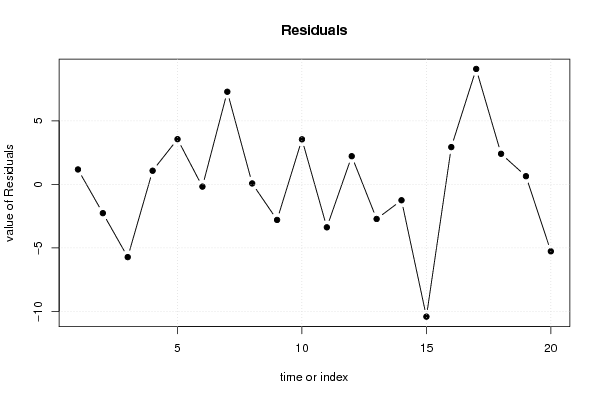
| Multiple Linear Regression - Actuals, Interpolation, and Residuals | |||
| Time or Index | Actuals | Interpolation Forecast | Residuals Prediction Error |
| 1 | 6 | 4.824 | 1.176 |
| 2 | 7 | 9.267 | -2.267 |
| 3 | 2 | 7.729 | -5.729 |
| 4 | 11 | 9.926 | 1.074 |
| 5 | 13 | 9.441 | 3.559 |
| 6 | 3 | 3.177 | -0.1771 |
| 7 | 17 | 9.705 | 7.295 |
| 8 | 10 | 9.926 | 0.07422 |
| 9 | 4 | 6.801 | -2.801 |
| 10 | 12 | 8.452 | 3.548 |
| 11 | 7 | 10.38 | -3.383 |
| 12 | 11 | 8.782 | 2.218 |
| 13 | 3 | 5.724 | -2.724 |
| 14 | 5 | 6.251 | -1.251 |
| 15 | 1 | 11.42 | -10.42 |
| 16 | 12 | 9.065 | 2.935 |
| 17 | 18 | 8.909 | 9.091 |
| 18 | 8 | 5.592 | 2.408 |
| 19 | 6 | 5.355 | 0.6445 |
| 20 | 1 | 6.274 | -5.274 |
| Ramsey RESET F-Test for powers (2 and 3) of fitted values |
> reset_test_fitted RESET test data: mylm RESET = 6.5714, df1 = 2, df2 = 12, p-value = 0.01182 |
| Ramsey RESET F-Test for powers (2 and 3) of regressors |
> reset_test_regressors RESET test data: mylm RESET = 0.57787, df1 = 10, df2 = 4, p-value = 0.7805 |
| Ramsey RESET F-Test for powers (2 and 3) of principal components |
> reset_test_principal_components RESET test data: mylm RESET = 0.01596, df1 = 2, df2 = 12, p-value = 0.9842 |
| Variance Inflation Factors (Multicollinearity) |
> vif
      X1       X2       X3       X4       X5
1.506117 1.349957 1.048553 1.358087 1.075153
|