| Multiple Linear Regression - Estimated Regression Equation |
| bouwvergunningen[t] = + 1120.31 + 14.6622Inflatie[t] + 1.76638Consumentenvertrouwen[t] -0.0226712huwelijken[t] + 0.641911`bouwvergunningen(t-1)`[t] + 0.0201976`bouwvergunningen(t-2)`[t] + 0.093164`bouwvergunningen(t-3)`[t] -0.316766`bouwvergunningen(t-4)`[t] + 0.0681825`bouwvergunningen(t-1s)`[t] + e[t] |
| Warning: you did not specify the column number of the endogenous series! The first column was selected by default. |
| Multiple Linear Regression - Ordinary Least Squares | |||||
| Variable | Parameter | S.D. | T-STAT H0: parameter = 0 | 2-tail p-value | 1-tail p-value |
| (Intercept) | +1120 | 302.5 | +3.7040e+00 | 0.0003724 | 0.0001862 |
| Inflatie | +14.66 | 20.51 | +7.1480e-01 | 0.4766 | 0.2383 |
| Consumentenvertrouwen | +1.766 | 5.035 | +3.5080e-01 | 0.7266 | 0.3633 |
| huwelijken | -0.02267 | 0.02304 | -9.8400e-01 | 0.3279 | 0.1639 |
| `bouwvergunningen(t-1)` | +0.6419 | 0.1002 | +6.4060e+00 | 7.391e-09 | 3.696e-09 |
| `bouwvergunningen(t-2)` | +0.0202 | 0.1239 | +1.6300e-01 | 0.8709 | 0.4355 |
| `bouwvergunningen(t-3)` | +0.09316 | 0.1208 | +7.7090e-01 | 0.4429 | 0.2214 |
| `bouwvergunningen(t-4)` | -0.3168 | 0.1026 | -3.0870e+00 | 0.002711 | 0.001356 |
| `bouwvergunningen(t-1s)` | +0.06818 | 0.08576 | +7.9500e-01 | 0.4288 | 0.2144 |
| Multiple Linear Regression - Regression Statistics | |
| Multiple R | 0.7213 |
| R-squared | 0.5203 |
| Adjusted R-squared | 0.4762 |
| F-TEST (value) | 11.8 |
| F-TEST (DF numerator) | 8 |
| F-TEST (DF denominator) | 87 |
| p-value | 3.118e-11 |
| Multiple Linear Regression - Residual Statistics | |
| Residual Standard Deviation | 331.4 |
| Sum Squared Residuals | 9.557e+06 |
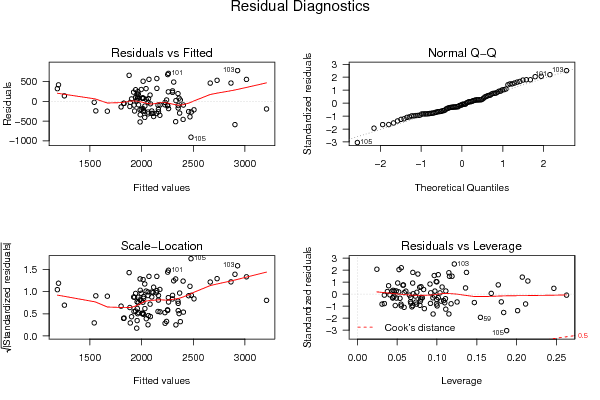
| Menu of Residual Diagnostics | |
| Description | Link |
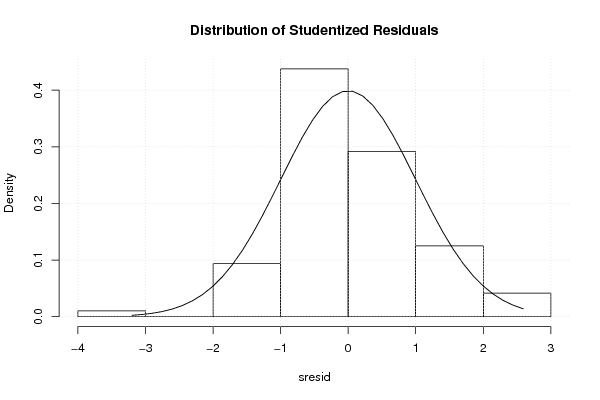
| Histogram | Compute |
| Central Tendency | Compute |
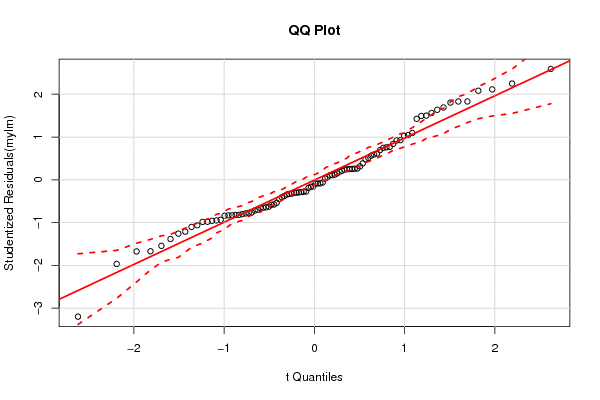
| QQ Plot | Compute |
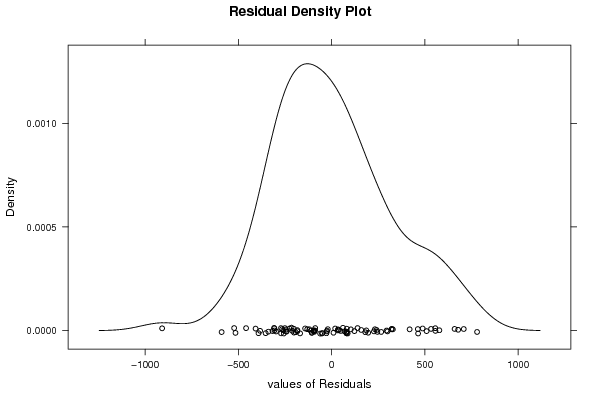
| Kernel Density Plot | Compute |
| Skewness/Kurtosis Test | Compute |
| Skewness-Kurtosis Plot | Compute |
| Harrell-Davis Plot | Compute |
| Bootstrap Plot -- Central Tendency | Compute |
| Blocked Bootstrap Plot -- Central Tendency | Compute |
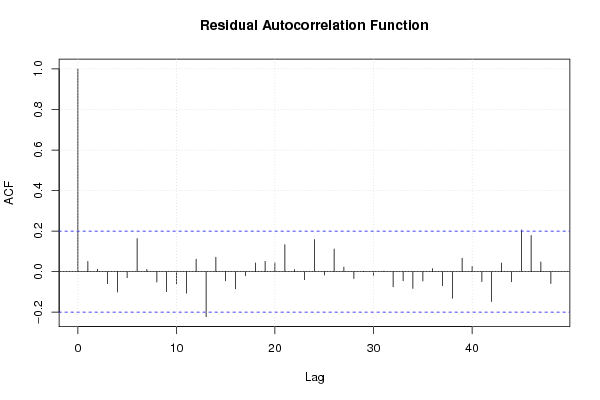
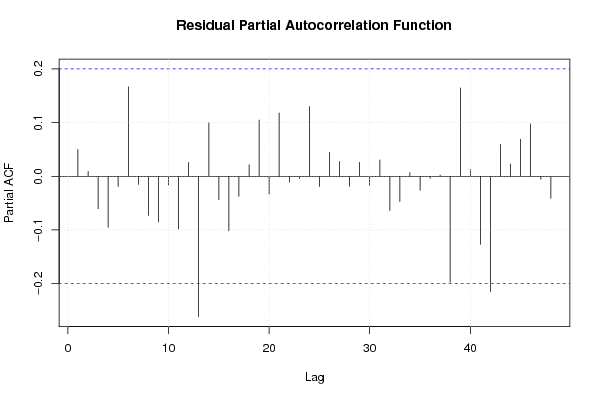
| (Partial) Autocorrelation Plot | Compute |
| Spectral Analysis | Compute |
| Tukey lambda PPCC Plot | Compute |
| Box-Cox Normality Plot | Compute |
| Summary Statistics | Compute |
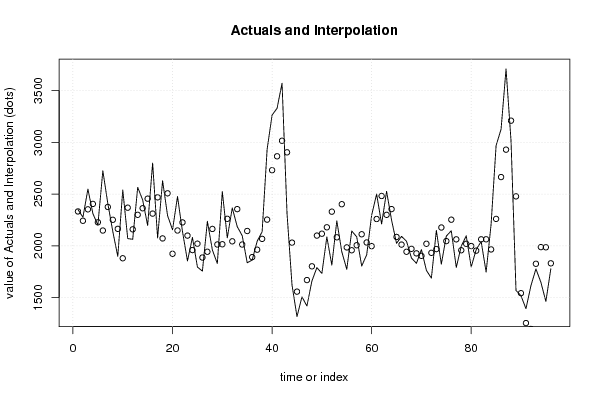
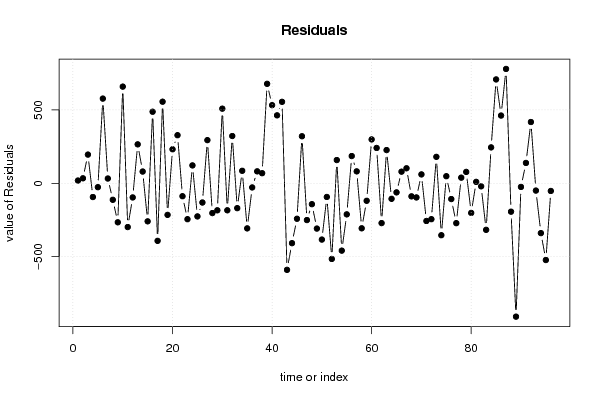
| Multiple Linear Regression - Actuals, Interpolation, and Residuals | |||
| Time or Index | Actuals | Interpolation Forecast | Residuals Prediction Error |
| 1 | 2351 | 2332 | 18.88 |
| 2 | 2276 | 2242 | 34.08 |
| 3 | 2548 | 2352 | 195.7 |
| 4 | 2311 | 2404 | -93.46 |
| 5 | 2201 | 2227 | -26.34 |
| 6 | 2725 | 2148 | 577.4 |
| 7 | 2408 | 2375 | 32.74 |
| 8 | 2139 | 2251 | -112.4 |
| 9 | 1898 | 2164 | -265.8 |
| 10 | 2539 | 1880 | 659.1 |
| 11 | 2070 | 2368 | -298.2 |
| 12 | 2063 | 2159 | -96.23 |
| 13 | 2565 | 2299 | 265.6 |
| 14 | 2443 | 2363 | 80.18 |
| 15 | 2196 | 2455 | -259.3 |
| 16 | 2799 | 2311 | 488 |
| 17 | 2076 | 2468 | -392.2 |
| 18 | 2628 | 2072 | 556.3 |
| 19 | 2292 | 2507 | -215.1 |
| 20 | 2155 | 1923 | 231.9 |
| 21 | 2476 | 2148 | 327.9 |
| 22 | 2138 | 2226 | -88.04 |
| 23 | 1854 | 2099 | -244.6 |
| 24 | 2081 | 1959 | 122 |
| 25 | 1795 | 2021 | -225.6 |
| 26 | 1756 | 1887 | -130.9 |
| 27 | 2237 | 1943 | 294.2 |
| 28 | 1960 | 2163 | -203 |
| 29 | 1829 | 2013 | -184 |
| 30 | 2524 | 2015 | 508.8 |
| 31 | 2077 | 2261 | -183.9 |
| 32 | 2366 | 2044 | 322.3 |
| 33 | 2185 | 2354 | -169.4 |
| 34 | 2098 | 2013 | 85.41 |
| 35 | 1836 | 2143 | -307.2 |
| 36 | 1863 | 1891 | -28.16 |
| 37 | 2044 | 1962 | 81.51 |
| 38 | 2136 | 2067 | 68.84 |
| 39 | 2931 | 2253 | 678.1 |
| 40 | 3263 | 2730 | 532.7 |
| 41 | 3328 | 2865 | 463.3 |
| 42 | 3570 | 3015 | 555.4 |
| 43 | 2313 | 2903 | -590 |
| 44 | 1623 | 2031 | -407.9 |
| 45 | 1316 | 1558 | -241.7 |
| 46 | 1507 | 1186 | 320.8 |
| 47 | 1419 | 1669 | -250.5 |
| 48 | 1660 | 1802 | -142.3 |
| 49 | 1790 | 2099 | -308.7 |
| 50 | 1733 | 2117 | -383.6 |
| 51 | 2086 | 2179 | -93.06 |
| 52 | 1814 | 2330 | -515.6 |
| 53 | 2241 | 2082 | 158.6 |
| 54 | 1943 | 2402 | -458.9 |
| 55 | 1773 | 1985 | -211.7 |
| 56 | 2143 | 1957 | 185.9 |
| 57 | 2087 | 2006 | 81.36 |
| 58 | 1805 | 2112 | -306.7 |
| 59 | 1913 | 2032 | -119.2 |
| 60 | 2296 | 1997 | 299.2 |
| 61 | 2500 | 2259 | 241 |
| 62 | 2210 | 2481 | -271.2 |
| 63 | 2526 | 2299 | 226.6 |
| 64 | 2249 | 2355 | -105.7 |
| 65 | 2024 | 2086 | -61.77 |
| 66 | 2091 | 2012 | 79.28 |
| 67 | 2045 | 1943 | 102.4 |
| 68 | 1882 | 1971 | -88.97 |
| 69 | 1831 | 1927 | -96.24 |
| 70 | 1964 | 1903 | 60.71 |
| 71 | 1763 | 2020 | -256.8 |
| 72 | 1688 | 1933 | -244.5 |
| 73 | 2149 | 1969 | 180.4 |
| 74 | 1823 | 2177 | -354 |
| 75 | 2094 | 2046 | 48.29 |
| 76 | 2145 | 2252 | -107.2 |
| 77 | 1791 | 2063 | -271.7 |
| 78 | 1996 | 1957 | 38.66 |
| 79 | 2097 | 2019 | 77.68 |
| 80 | 1796 | 1998 | -201.8 |
| 81 | 1963 | 1953 | 9.824 |
| 82 | 2042 | 2063 | -20.63 |
| 83 | 1746 | 2063 | -317.2 |
| 84 | 2210 | 1965 | 244.8 |
| 85 | 2968 | 2260 | 708.2 |
| 86 | 3126 | 2664 | 461.9 |
| 87 | 3708 | 2928 | 779.6 |
| 88 | 3015 | 3208 | -193.4 |
| 89 | 1569 | 2478 | -908.9 |
| 90 | 1518 | 1543 | -24.73 |
| 91 | 1393 | 1254 | 138.8 |
| 92 | 1615 | 1197 | 417.9 |
| 93 | 1777 | 1826 | -49.49 |
| 94 | 1648 | 1988 | -339.5 |
| 95 | 1463 | 1986 | -522.8 |
| 96 | 1779 | 1831 | -52.13 |
| Goldfeld-Quandt test for Heteroskedasticity | |||
| p-values | Alternative Hypothesis | ||
| breakpoint index | greater | 2-sided | less |
| 12 | 0.3555 | 0.7111 | 0.6445 |
| 13 | 0.2443 | 0.4886 | 0.7557 |
| 14 | 0.1723 | 0.3446 | 0.8277 |
| 15 | 0.1001 | 0.2002 | 0.8999 |
| 16 | 0.2971 | 0.5943 | 0.7029 |
| 17 | 0.2353 | 0.4706 | 0.7647 |
| 18 | 0.323 | 0.646 | 0.677 |
| 19 | 0.3336 | 0.6673 | 0.6664 |
| 20 | 0.2884 | 0.5769 | 0.7116 |
| 21 | 0.2242 | 0.4484 | 0.7758 |
| 22 | 0.1782 | 0.3564 | 0.8218 |
| 23 | 0.1618 | 0.3237 | 0.8382 |
| 24 | 0.1231 | 0.2463 | 0.8769 |
| 25 | 0.1235 | 0.247 | 0.8765 |
| 26 | 0.09386 | 0.1877 | 0.9061 |
| 27 | 0.08573 | 0.1715 | 0.9143 |
| 28 | 0.06148 | 0.123 | 0.9385 |
| 29 | 0.04705 | 0.09409 | 0.953 |
| 30 | 0.0506 | 0.1012 | 0.9494 |
| 31 | 0.03794 | 0.07588 | 0.9621 |
| 32 | 0.0402 | 0.08039 | 0.9598 |
| 33 | 0.02874 | 0.05748 | 0.9713 |
| 34 | 0.0198 | 0.03961 | 0.9802 |
| 35 | 0.01699 | 0.03398 | 0.983 |
| 36 | 0.01486 | 0.02972 | 0.9851 |
| 37 | 0.009437 | 0.01887 | 0.9906 |
| 38 | 0.006261 | 0.01252 | 0.9937 |
| 39 | 0.04297 | 0.08595 | 0.957 |
| 40 | 0.2015 | 0.403 | 0.7985 |
| 41 | 0.316 | 0.6319 | 0.684 |
| 42 | 0.4644 | 0.9288 | 0.5356 |
| 43 | 0.5302 | 0.9396 | 0.4698 |
| 44 | 0.4928 | 0.9856 | 0.5072 |
| 45 | 0.4409 | 0.8817 | 0.5591 |
| 46 | 0.474 | 0.9479 | 0.526 |
| 47 | 0.5111 | 0.9777 | 0.4889 |
| 48 | 0.5201 | 0.9597 | 0.4799 |
| 49 | 0.5563 | 0.8875 | 0.4437 |
| 50 | 0.5986 | 0.8028 | 0.4014 |
| 51 | 0.5544 | 0.8912 | 0.4456 |
| 52 | 0.6534 | 0.6932 | 0.3466 |
| 53 | 0.62 | 0.7601 | 0.38 |
| 54 | 0.7006 | 0.5987 | 0.2994 |
| 55 | 0.6957 | 0.6086 | 0.3043 |
| 56 | 0.6523 | 0.6954 | 0.3477 |
| 57 | 0.594 | 0.8121 | 0.406 |
| 58 | 0.5751 | 0.8499 | 0.4249 |
| 59 | 0.5172 | 0.9657 | 0.4828 |
| 60 | 0.4851 | 0.9701 | 0.5149 |
| 61 | 0.4368 | 0.8735 | 0.5632 |
| 62 | 0.4187 | 0.8375 | 0.5813 |
| 63 | 0.3703 | 0.7405 | 0.6297 |
| 64 | 0.3176 | 0.6351 | 0.6824 |
| 65 | 0.2659 | 0.5319 | 0.7341 |
| 66 | 0.2139 | 0.4278 | 0.7861 |
| 67 | 0.1687 | 0.3374 | 0.8313 |
| 68 | 0.1284 | 0.2568 | 0.8716 |
| 69 | 0.0995 | 0.199 | 0.9005 |
| 70 | 0.09999 | 0.2 | 0.9 |
| 71 | 0.07519 | 0.1504 | 0.9248 |
| 72 | 0.05461 | 0.1092 | 0.9454 |
| 73 | 0.03875 | 0.0775 | 0.9613 |
| 74 | 0.04158 | 0.08316 | 0.9584 |
| 75 | 0.02992 | 0.05984 | 0.9701 |
| 76 | 0.03181 | 0.06362 | 0.9682 |
| 77 | 0.1032 | 0.2064 | 0.8968 |
| 78 | 0.07424 | 0.1485 | 0.9258 |
| 79 | 0.04732 | 0.09465 | 0.9527 |
| 80 | 0.02952 | 0.05904 | 0.9705 |
| 81 | 0.01964 | 0.03928 | 0.9804 |
| 82 | 0.009854 | 0.01971 | 0.9901 |
| 83 | 0.1082 | 0.2163 | 0.8918 |
| 84 | 0.1929 | 0.3858 | 0.8071 |
| Meta Analysis of Goldfeld-Quandt test for Heteroskedasticity | |||
| Description | # significant tests | % significant tests | OK/NOK |
| 1% type I error level | 0 | 0 | OK |
| 5% type I error level | 7 | 0.0958904 | NOK |
| 10% type I error level | 18 | 0.246575 | NOK |
| Ramsey RESET F-Test for powers (2 and 3) of fitted values |
> reset_test_fitted RESET test data: mylm RESET = 2.7389, df1 = 2, df2 = 85, p-value = 0.07035 |
| Ramsey RESET F-Test for powers (2 and 3) of regressors |
> reset_test_regressors RESET test data: mylm RESET = 2.8581, df1 = 16, df2 = 71, p-value = 0.001254 |
| Ramsey RESET F-Test for powers (2 and 3) of principal components |
> reset_test_principal_components RESET test data: mylm RESET = 0.12429, df1 = 2, df2 = 85, p-value = 0.8833 |
| Variance Inflation Factors (Multicollinearity) |
> vif
                Inflatie    Consumentenvertrouwen               huwelijken
                1.042346                 1.081336                 1.269371
 `bouwvergunningen(t-1)`  `bouwvergunningen(t-2)`  `bouwvergunningen(t-3)`
                1.811566                 2.708077                 2.555355
 `bouwvergunningen(t-4)` `bouwvergunningen(t-1s)`
                1.833139                 1.072406
|