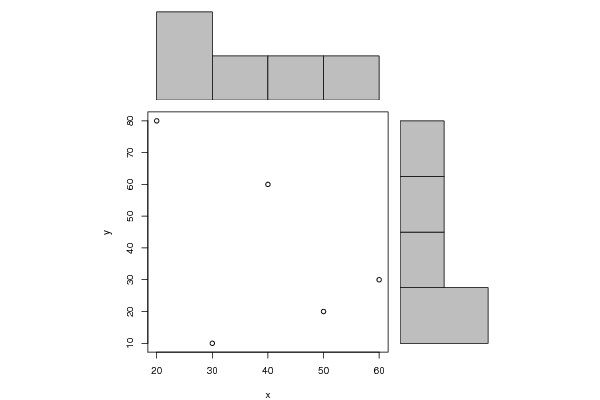
| Pearson Product Moment Correlation - Ungrouped Data | ||
| Statistic | Variable X | Variable Y |
| Mean | 40 | 40 |
| Biased Variance | 200 | 680 |
| Biased Standard Deviation | 14.142135623731 | 26.0768096208106 |
| Covariance | -225 | |
| Correlation | -0.488093530091976 | |
| Determination | 0.238235294117647 | |
| T-Test | -0.968619604501136 | |
| p-value (2 sided) | 0.404182538276366 | |
| p-value (1 sided) | 0.202091269138183 | |
| 95% CI of Correlation | [-0.957872657395146, 0.692294783472888] | |
| Degrees of Freedom | 3 | |
| Number of Observations | 5 | |
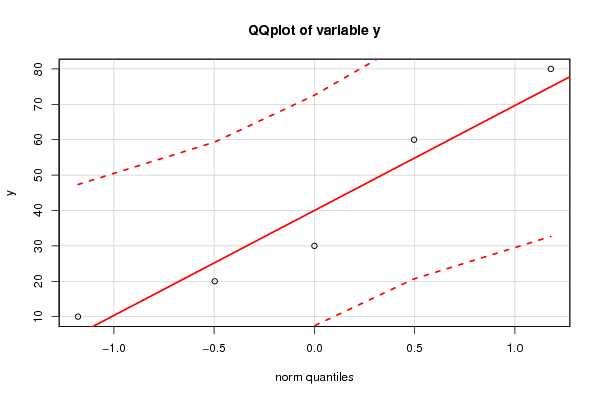
| Normality Tests |
> jarque.x Jarque-Bera Normality Test data: x JB = 0.35208, p-value = 0.8386 alternative hypothesis: greater |
> jarque.y Jarque-Bera Normality Test data: y JB = 0.54552, p-value = 0.7613 alternative hypothesis: greater |