| Multiple Linear Regression - Estimated Regression Equation |
| barrels_purchased[t] = + 19652.8 -23789.6defl_price[t] -40663.4defl_price1[t] + 0.286981`barrels_purchased(t-1)`[t] + 0.291205`barrels_purchased(t-2)`[t] + 0.13146`barrels_purchased(t-3)`[t] -0.0886844`barrels_purchased(t-4)`[t] + 0.294485`barrels_purchased(t-1s)`[t] + 0.0617598`barrels_purchased(t-2s)`[t] + e[t] |
| Multiple Linear Regression - Ordinary Least Squares | |||||
| Variable | Parameter | S.D. | T-STAT H0: parameter = 0 | 2-tail p-value | 1-tail p-value |
| (Intercept) | +1.965e+04 | 4228 | +4.6480e+00 | 4.628e-06 | 2.314e-06 |
| defl_price | -2.379e+04 | 8.432e+04 | -2.8220e-01 | 0.778 | 0.389 |
| defl_price1 | -4.066e+04 | 8.586e+04 | -4.7360e-01 | 0.6361 | 0.318 |
| `barrels_purchased(t-1)` | +0.287 | 0.04882 | +5.8780e+00 | 9.04e-09 | 4.52e-09 |
| `barrels_purchased(t-2)` | +0.2912 | 0.05036 | +5.7820e+00 | 1.536e-08 | 7.68e-09 |
| `barrels_purchased(t-3)` | +0.1315 | 0.04952 | +2.6550e+00 | 0.00827 | 0.004135 |
| `barrels_purchased(t-4)` | -0.08868 | 0.04637 | -1.9130e+00 | 0.05655 | 0.02827 |
| `barrels_purchased(t-1s)` | +0.2945 | 0.04623 | +6.3700e+00 | 5.425e-10 | 2.713e-10 |
| `barrels_purchased(t-2s)` | +0.06176 | 0.038 | +1.6250e+00 | 0.105 | 0.05248 |
| Multiple Linear Regression - Regression Statistics | |
| Multiple R | 0.9687 |
| R-squared | 0.9383 |
| Adjusted R-squared | 0.937 |
| F-TEST (value) | 726.2 |
| F-TEST (DF numerator) | 8 |
| F-TEST (DF denominator) | 382 |
| p-value | 0 |
| Multiple Linear Regression - Residual Statistics | |
| Residual Standard Deviation | 1.744e+04 |
| Sum Squared Residuals | 1.162e+11 |
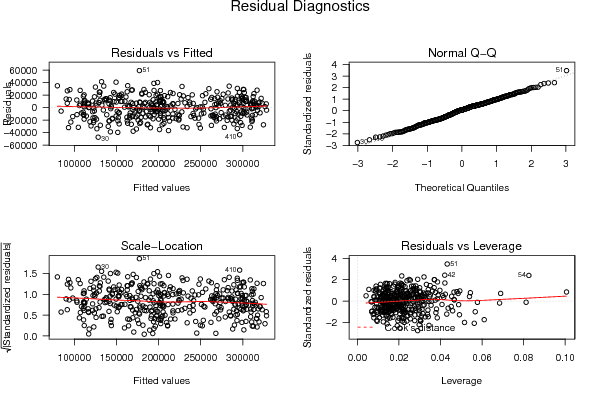
| Menu of Residual Diagnostics | |
| Description | Link |
| Histogram | Compute |
| Central Tendency | Compute |
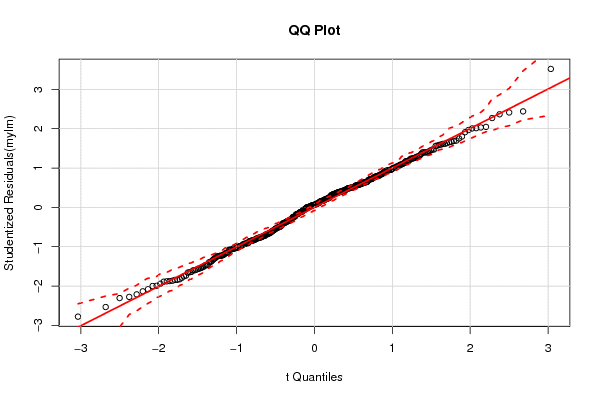
| QQ Plot | Compute |
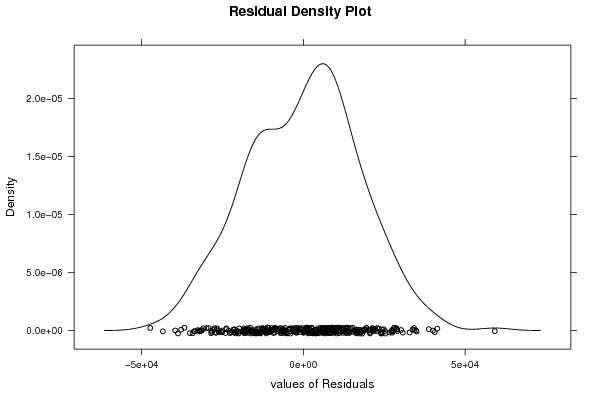
| Kernel Density Plot | Compute |
| Skewness/Kurtosis Test | Compute |
| Skewness-Kurtosis Plot | Compute |
| Harrell-Davis Plot | Compute |
| Bootstrap Plot -- Central Tendency | Compute |
| Blocked Bootstrap Plot -- Central Tendency | Compute |
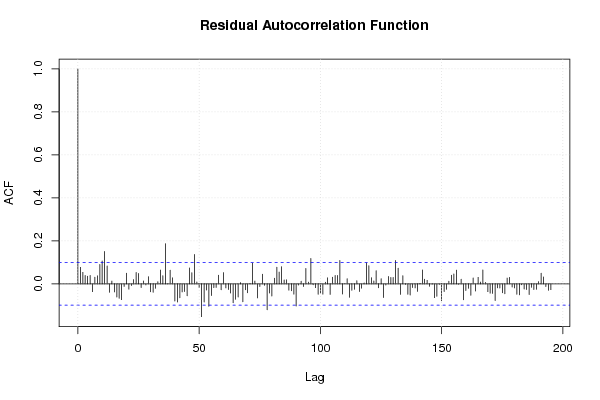
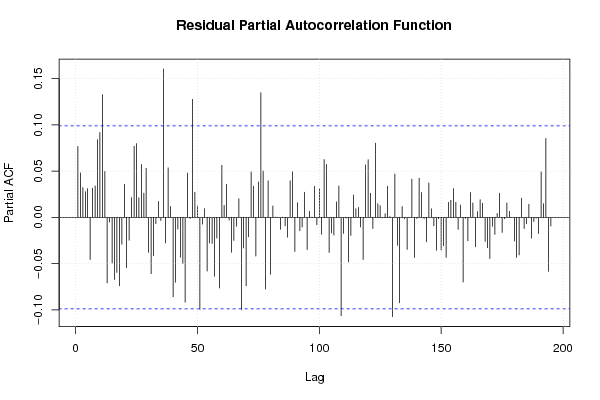
| (Partial) Autocorrelation Plot | Compute |
| Spectral Analysis | Compute |
| Tukey lambda PPCC Plot | Compute |
| Box-Cox Normality Plot | Compute |
| Summary Statistics | Compute |
| Ramsey RESET F-Test for powers (2 and 3) of fitted values |
> reset_test_fitted RESET test data: mylm RESET = 0.60232, df1 = 2, df2 = 380, p-value = 0.5481 |
| Ramsey RESET F-Test for powers (2 and 3) of regressors |
> reset_test_regressors RESET test data: mylm RESET = 2.7504, df1 = 16, df2 = 366, p-value = 0.000351 |
| Ramsey RESET F-Test for powers (2 and 3) of principal components |
> reset_test_principal_components RESET test data: mylm RESET = 1.5779, df1 = 2, df2 = 380, p-value = 0.2078 |
| Variance Inflation Factors (Multicollinearity) |
> vif
               defl_price               defl_price1  `barrels_purchased(t-1)`
                73.056284                 74.756342                 14.758946
 `barrels_purchased(t-2)`  `barrels_purchased(t-3)`  `barrels_purchased(t-4)`
                15.668763                 15.186948                 13.336240
`barrels_purchased(t-1s)` `barrels_purchased(t-2s)`
                12.933237                  8.533204
|