| Pearson Product Moment Correlation - Ungrouped Data | ||
| Statistic | Variable X | Variable Y |
| Mean | 0.36475 | 0.2755 |
| Biased Variance | 0.0264706875 | 0.00925025 |
| Biased Standard Deviation | 0.162698148422162 | 0.0961782199876874 |
| Covariance | 0.0207051666666667 | |
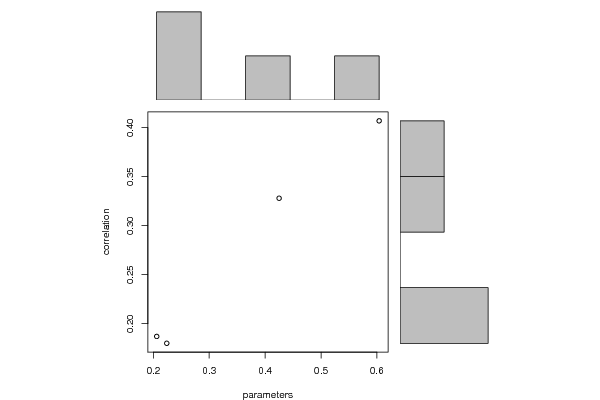
| Correlation | 0.992386044790353 | |
| Determination | 0.98483006189464 | |
| T-Test | 11.3947222056701 | |
| p-value (2 sided) | 0.00761395520964723 | |
| p-value (1 sided) | 0.00380697760482361 | |
| 95% CI of Correlation | [0.677018425587536, 0.999848354053881] | |
| Degrees of Freedom | 2 | |
| Number of Observations | 4 | |
| Normality Tests |
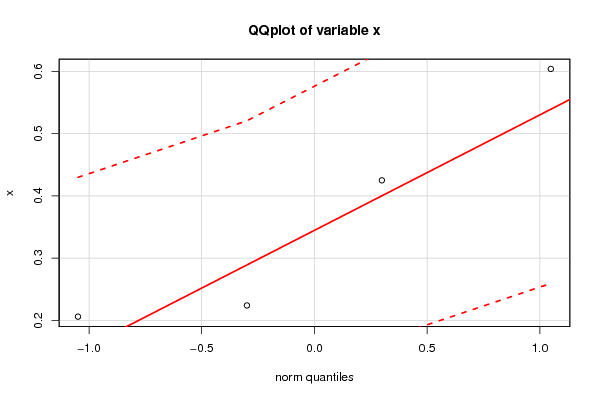
> jarque.x Jarque-Bera Normality Test data: x JB = 0.46913, p-value = 0.7909 alternative hypothesis: greater |
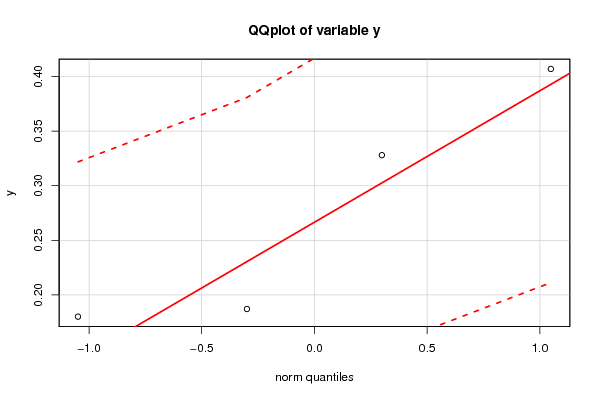
> jarque.y Jarque-Bera Normality Test data: y JB = 0.50991, p-value = 0.775 alternative hypothesis: greater |