Free Statistics

of Irreproducible Research!

Author's title

Author*Unverified author*
R Software Modulerwasp_kendall.wasp
Title produced by softwareKendall tau Rank Correlation
Date of computationMon, 12 Feb 2018 10:14:22 +0100
Cite this page as followsStatistical Computations at FreeStatistics.org, Office for Research Development and Education, URL https://freestatistics.org/blog/index.php?v=date/2018/Feb/12/t1518426954mcwbmvtmay6t7ta.htm/, Retrieved Mon, 29 Apr 2024 09:09:24 +0000
Statistical Computations at FreeStatistics.org, Office for Research Development and Education, URL https://freestatistics.org/blog/index.php?pk=314976, Retrieved Mon, 29 Apr 2024 09:09:24 +0000
QR Codes:

Original text written by user:
IsPrivate?No (this computation is public)
User-defined keywords
Estimated Impact138
Family? (F = Feedback message, R = changed R code, M = changed R Module, P = changed Parameters, D = changed Data)
-       [Kendall tau Rank Correlation] [] [2018-02-12 09:14:22] [d41d8cd98f00b204e9800998ecf8427e] [Current]
Feedback Forum

Post a new message
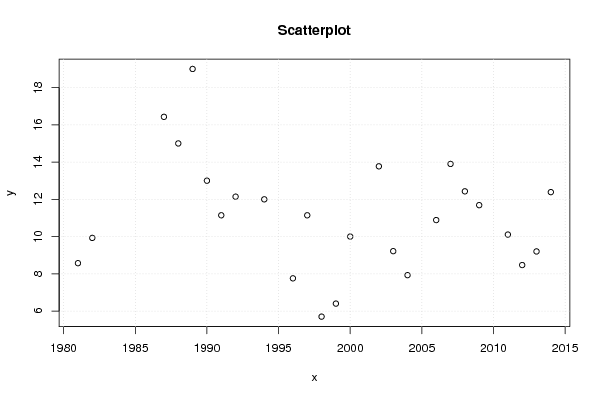
Dataseries X:
1981
1982
1987
1988
1989
1990
1991
1992
1994
1996
1997
1998
1999
2000
2002
2003
2004
2006
2007
2008
2009
2011
2012
2013
2014
Dataseries Y:
8.571428571
9.928571429
16.42857143
15
19
13
11.14285714
12.14285714
12
7.757142857
11.14285714
5.7
6.4
10
13.77142857
9.215714286
7.927142857
10.88571429
13.9
12.42857143
11.68571429
10.10714286
8.471428571
9.201428571
12.38571429


Summary of computational transaction
Raw Input view raw input (R code)
Raw Outputview raw output of R engine
Computing time2 seconds
R ServerBig Analytics Cloud Computing Center

\begin{tabular}{lllllllll}
\hline
Summary of computational transaction \tabularnewline
Raw Input view raw input (R code)  \tabularnewline
Raw Outputview raw output of R engine  \tabularnewline
Computing time2 seconds \tabularnewline
R ServerBig Analytics Cloud Computing Center \tabularnewline
\hline
\end{tabular}
%Source: https://freestatistics.org/blog/index.php?pk=314976&T=0

[TABLE]
[ROW]
Summary of computational transaction[/C][/ROW] [ROW]Raw Input[/C] view raw input (R code) [/C][/ROW] [ROW]Raw Output[/C]view raw output of R engine [/C][/ROW] [ROW]Computing time[/C]2 seconds[/C][/ROW] [ROW]R Server[/C]Big Analytics Cloud Computing Center[/C][/ROW] [/TABLE] Source: https://freestatistics.org/blog/index.php?pk=314976&T=0

Globally Unique Identifier (entire table): ba.freestatistics.org/blog/index.php?pk=314976&T=0

As an alternative you can also use a QR Code:  

The GUIDs for individual cells are displayed in the table below:

Summary of computational transaction
Raw Input view raw input (R code)
Raw Outputview raw output of R engine
Computing time2 seconds
R ServerBig Analytics Cloud Computing Center


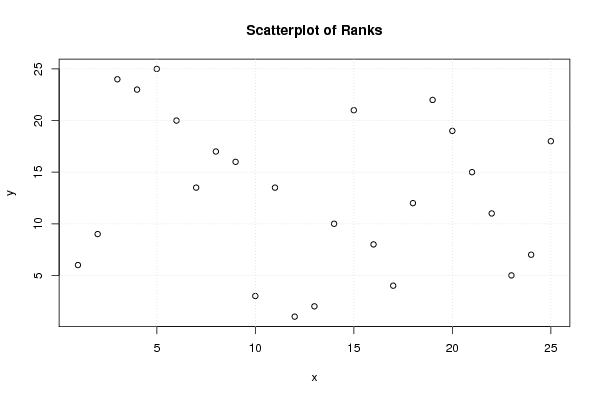
Kendall tau Rank Correlation
Kendall tau-0.143572807312012
2-sided p-value0.326505780220032
Score-43
Var(Score)1832.33337402344
Denominator299.499603271484

\begin{tabular}{lllllllll}
\hline
Kendall tau Rank Correlation \tabularnewline
Kendall tau & -0.143572807312012 \tabularnewline
2-sided p-value & 0.326505780220032 \tabularnewline
Score & -43 \tabularnewline
Var(Score) & 1832.33337402344 \tabularnewline
Denominator & 299.499603271484 \tabularnewline
\hline
\end{tabular}
%Source: https://freestatistics.org/blog/index.php?pk=314976&T=1

[TABLE]
[ROW][C]Kendall tau Rank Correlation[/C][/ROW]
[ROW][C]Kendall tau[/C][C]-0.143572807312012[/C][/ROW]
[ROW][C]2-sided p-value[/C][C]0.326505780220032[/C][/ROW]
[ROW][C]Score[/C][C]-43[/C][/ROW]
[ROW][C]Var(Score)[/C][C]1832.33337402344[/C][/ROW]
[ROW][C]Denominator[/C][C]299.499603271484[/C][/ROW]
[/TABLE]
Source: https://freestatistics.org/blog/index.php?pk=314976&T=1

Globally Unique Identifier (entire table): ba.freestatistics.org/blog/index.php?pk=314976&T=1

As an alternative you can also use a QR Code:  

The GUIDs for individual cells are displayed in the table below:

Kendall tau Rank Correlation
Kendall tau-0.143572807312012
2-sided p-value0.326505780220032
Score-43
Var(Score)1832.33337402344
Denominator299.499603271484


Parameters (Session):
Parameters (R input):
R code (references can be found in the software module):
library('Kendall')
k <- Kendall(x,y)
bitmap(file='test1.png')
par(bg=rgb(0.2,0.4,0.6))
plot(x,y,main='Scatterplot',xlab=xlab,ylab=ylab)
grid()
dev.off()
bitmap(file='test2.png')
par(bg=rgb(0.2,0.4,0.6))
plot(rank(x),rank(y),main='Scatterplot of Ranks',xlab=xlab,ylab=ylab)
grid()
dev.off()
load(file='createtable')
a<-table.start()
a<-table.row.start(a)
a<-table.element(a,'Kendall tau Rank Correlation',2,TRUE)
a<-table.row.end(a)
a<-table.row.start(a)
a<-table.element(a,'Kendall tau',header=TRUE)
a<-table.element(a,k$tau)
a<-table.row.end(a)
a<-table.row.start(a)
a<-table.element(a,'2-sided p-value',header=TRUE)
a<-table.element(a,k$sl)
a<-table.row.end(a)
a<-table.row.start(a)
a<-table.element(a,'Score',header=TRUE)
a<-table.element(a,k$S)
a<-table.row.end(a)
a<-table.row.start(a)
a<-table.element(a,'Var(Score)',header=TRUE)
a<-table.element(a,k$varS)
a<-table.row.end(a)
a<-table.row.start(a)
a<-table.element(a,'Denominator',header=TRUE)
a<-table.element(a,k$D)
a<-table.row.end(a)
a<-table.end(a)
table.save(a,file='mytable.tab')