Free Statistics

of Irreproducible Research!

Author's title

Author*Unverified author*
R Software Modulerwasp_cross.wasp
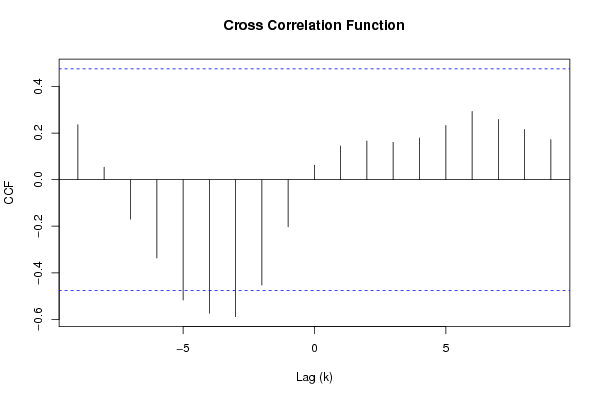
Title produced by softwareCross Correlation Function
Date of computationMon, 05 Feb 2018 04:34:21 +0100
Cite this page as followsStatistical Computations at FreeStatistics.org, Office for Research Development and Education, URL https://freestatistics.org/blog/index.php?v=date/2018/Feb/05/t151780227765jcth93abm40t5.htm/, Retrieved Tue, 30 Apr 2024 00:34:18 +0000
Statistical Computations at FreeStatistics.org, Office for Research Development and Education, URL https://freestatistics.org/blog/index.php?pk=314970, Retrieved Tue, 30 Apr 2024 00:34:18 +0000
QR Codes:

Original text written by user:
IsPrivate?No (this computation is public)
User-defined keywords
Estimated Impact153
Family? (F = Feedback message, R = changed R code, M = changed R Module, P = changed Parameters, D = changed Data)
-       [Cross Correlation Function] [Ejercicio correla...] [2018-02-05 03:34:21] [d41d8cd98f00b204e9800998ecf8427e] [Current]
Feedback Forum

Post a new message
Dataseries X:
99.2
99
100
111.6
122.2
117.6
121.1
136
154.2
153.6
158.5
140.6
136.2
168
154.3
149
165.5
Dataseries Y:
96.7
98.1
100
104.9
104.9
109.5
110.8
112.3
109.3
105.3
101.7
95.4
96.4
97.6
102.4
101.6
103.8


Summary of computational transaction
Raw Input view raw input (R code)
Raw Outputview raw output of R engine
Computing time1 seconds
R ServerBig Analytics Cloud Computing Center

\begin{tabular}{lllllllll}
\hline
Summary of computational transaction \tabularnewline
Raw Input view raw input (R code)  \tabularnewline
Raw Outputview raw output of R engine  \tabularnewline
Computing time1 seconds \tabularnewline
R ServerBig Analytics Cloud Computing Center \tabularnewline
\hline
\end{tabular}
%Source: https://freestatistics.org/blog/index.php?pk=314970&T=0

[TABLE]
[ROW]
Summary of computational transaction[/C][/ROW] [ROW]Raw Input[/C] view raw input (R code) [/C][/ROW] [ROW]Raw Output[/C]view raw output of R engine [/C][/ROW] [ROW]Computing time[/C]1 seconds[/C][/ROW] [ROW]R Server[/C]Big Analytics Cloud Computing Center[/C][/ROW] [/TABLE] Source: https://freestatistics.org/blog/index.php?pk=314970&T=0

Globally Unique Identifier (entire table): ba.freestatistics.org/blog/index.php?pk=314970&T=0

As an alternative you can also use a QR Code:  

The GUIDs for individual cells are displayed in the table below:

Summary of computational transaction
Raw Input view raw input (R code)
Raw Outputview raw output of R engine
Computing time1 seconds
R ServerBig Analytics Cloud Computing Center


Cross Correlation Function
ParameterValue
Box-Cox transformation parameter (lambda) of X series1
Degree of non-seasonal differencing (d) of X series0
Degree of seasonal differencing (D) of X series0
Seasonal Period (s)1
Box-Cox transformation parameter (lambda) of Y series1
Degree of non-seasonal differencing (d) of Y series0
Degree of seasonal differencing (D) of Y series0
krho(Y[t],X[t+k])
-90.236006556160983
-80.053221581239011
-7-0.169833066960884
-6-0.336047226350378
-5-0.517192563302102
-4-0.573470967646541
-3-0.5885180954614
-2-0.452605867411525
-1-0.202374044224987
00.0617694041009443
10.144479690299472
20.166031833197589
30.159983697754745
40.179177574128377
50.232674124098104
60.292424183865019
70.258003898887469
80.215196574475449
90.171680328730759

\begin{tabular}{lllllllll}
\hline
Cross Correlation Function \tabularnewline
Parameter & Value \tabularnewline
Box-Cox transformation parameter (lambda) of X series & 1 \tabularnewline
Degree of non-seasonal differencing (d) of X series & 0 \tabularnewline
Degree of seasonal differencing (D) of X series & 0 \tabularnewline
Seasonal Period (s) & 1 \tabularnewline
Box-Cox transformation parameter (lambda) of Y series & 1 \tabularnewline
Degree of non-seasonal differencing (d) of Y series & 0 \tabularnewline
Degree of seasonal differencing (D) of Y series & 0 \tabularnewline
k & rho(Y[t],X[t+k]) \tabularnewline
-9 & 0.236006556160983 \tabularnewline
-8 & 0.053221581239011 \tabularnewline
-7 & -0.169833066960884 \tabularnewline
-6 & -0.336047226350378 \tabularnewline
-5 & -0.517192563302102 \tabularnewline
-4 & -0.573470967646541 \tabularnewline
-3 & -0.5885180954614 \tabularnewline
-2 & -0.452605867411525 \tabularnewline
-1 & -0.202374044224987 \tabularnewline
0 & 0.0617694041009443 \tabularnewline
1 & 0.144479690299472 \tabularnewline
2 & 0.166031833197589 \tabularnewline
3 & 0.159983697754745 \tabularnewline
4 & 0.179177574128377 \tabularnewline
5 & 0.232674124098104 \tabularnewline
6 & 0.292424183865019 \tabularnewline
7 & 0.258003898887469 \tabularnewline
8 & 0.215196574475449 \tabularnewline
9 & 0.171680328730759 \tabularnewline
\hline
\end{tabular}
%Source: https://freestatistics.org/blog/index.php?pk=314970&T=1

[TABLE]
[ROW][C]Cross Correlation Function[/C][/ROW]
[ROW][C]Parameter[/C][C]Value[/C][/ROW]
[ROW][C]Box-Cox transformation parameter (lambda) of X series[/C][C]1[/C][/ROW]
[ROW][C]Degree of non-seasonal differencing (d) of X series[/C][C]0[/C][/ROW]
[ROW][C]Degree of seasonal differencing (D) of X series[/C][C]0[/C][/ROW]
[ROW][C]Seasonal Period (s)[/C][C]1[/C][/ROW]
[ROW][C]Box-Cox transformation parameter (lambda) of Y series[/C][C]1[/C][/ROW]
[ROW][C]Degree of non-seasonal differencing (d) of Y series[/C][C]0[/C][/ROW]
[ROW][C]Degree of seasonal differencing (D) of Y series[/C][C]0[/C][/ROW]
[ROW][C]k[/C][C]rho(Y[t],X[t+k])[/C][/ROW]
[ROW][C]-9[/C][C]0.236006556160983[/C][/ROW]
[ROW][C]-8[/C][C]0.053221581239011[/C][/ROW]
[ROW][C]-7[/C][C]-0.169833066960884[/C][/ROW]
[ROW][C]-6[/C][C]-0.336047226350378[/C][/ROW]
[ROW][C]-5[/C][C]-0.517192563302102[/C][/ROW]
[ROW][C]-4[/C][C]-0.573470967646541[/C][/ROW]
[ROW][C]-3[/C][C]-0.5885180954614[/C][/ROW]
[ROW][C]-2[/C][C]-0.452605867411525[/C][/ROW]
[ROW][C]-1[/C][C]-0.202374044224987[/C][/ROW]
[ROW][C]0[/C][C]0.0617694041009443[/C][/ROW]
[ROW][C]1[/C][C]0.144479690299472[/C][/ROW]
[ROW][C]2[/C][C]0.166031833197589[/C][/ROW]
[ROW][C]3[/C][C]0.159983697754745[/C][/ROW]
[ROW][C]4[/C][C]0.179177574128377[/C][/ROW]
[ROW][C]5[/C][C]0.232674124098104[/C][/ROW]
[ROW][C]6[/C][C]0.292424183865019[/C][/ROW]
[ROW][C]7[/C][C]0.258003898887469[/C][/ROW]
[ROW][C]8[/C][C]0.215196574475449[/C][/ROW]
[ROW][C]9[/C][C]0.171680328730759[/C][/ROW]
[/TABLE]
Source: https://freestatistics.org/blog/index.php?pk=314970&T=1

Globally Unique Identifier (entire table): ba.freestatistics.org/blog/index.php?pk=314970&T=1

As an alternative you can also use a QR Code:  

The GUIDs for individual cells are displayed in the table below:

Cross Correlation Function
ParameterValue
Box-Cox transformation parameter (lambda) of X series1
Degree of non-seasonal differencing (d) of X series0
Degree of seasonal differencing (D) of X series0
Seasonal Period (s)1
Box-Cox transformation parameter (lambda) of Y series1
Degree of non-seasonal differencing (d) of Y series0
Degree of seasonal differencing (D) of Y series0
krho(Y[t],X[t+k])
-90.236006556160983
-80.053221581239011
-7-0.169833066960884
-6-0.336047226350378
-5-0.517192563302102
-4-0.573470967646541
-3-0.5885180954614
-2-0.452605867411525
-1-0.202374044224987
00.0617694041009443
10.144479690299472
20.166031833197589
30.159983697754745
40.179177574128377
50.232674124098104
60.292424183865019
70.258003898887469
80.215196574475449
90.171680328730759


Parameters (Session):
par1 = 1 ; par2 = 0 ; par3 = 0 ; par4 = 1 ; par5 = 1 ; par6 = 0 ; par7 = 0 ; par8 = na.fail ;
Parameters (R input):
par1 = 1 ; par2 = 0 ; par3 = 0 ; par4 = 1 ; par5 = 1 ; par6 = 0 ; par7 = 0 ; par8 = na.fail ;
R code (references can be found in the software module):
par1 <- as.numeric(par1)
par2 <- as.numeric(par2)
par3 <- as.numeric(par3)
par4 <- as.numeric(par4)
par5 <- as.numeric(par5)
par6 <- as.numeric(par6)
par7 <- as.numeric(par7)
if (par8=='na.fail') par8 <- na.fail else par8 <- na.pass
ccf <- function (x, y, lag.max = NULL, type = c('correlation', 'covariance'), plot = TRUE, na.action = na.fail, ...) {
type <- match.arg(type)
if (is.matrix(x) || is.matrix(y))
stop('univariate time series only')
X <- na.action(ts.intersect(as.ts(x), as.ts(y)))
colnames(X) <- c(deparse(substitute(x))[1L], deparse(substitute(y))[1L])
acf.out <- acf(X, lag.max = lag.max, plot = FALSE, type = type, na.action=na.action)
lag <- c(rev(acf.out$lag[-1, 2, 1]), acf.out$lag[, 1, 2])
y <- c(rev(acf.out$acf[-1, 2, 1]), acf.out$acf[, 1, 2])
acf.out$acf <- array(y, dim = c(length(y), 1L, 1L))
acf.out$lag <- array(lag, dim = c(length(y), 1L, 1L))
acf.out$snames <- paste(acf.out$snames, collapse = ' & ')
if (plot) {
plot(acf.out, ...)
return(invisible(acf.out))
}
else return(acf.out)
}
if (par1 == 0) {
x <- log(x)
} else {
x <- (x ^ par1 - 1) / par1
}
if (par5 == 0) {
y <- log(y)
} else {
y <- (y ^ par5 - 1) / par5
}
if (par2 > 0) x <- diff(x,lag=1,difference=par2)
if (par6 > 0) y <- diff(y,lag=1,difference=par6)
if (par3 > 0) x <- diff(x,lag=par4,difference=par3)
if (par7 > 0) y <- diff(y,lag=par4,difference=par7)
print(x)
print(y)
bitmap(file='test1.png')
(r <- ccf(x,y,na.action=par8,main='Cross Correlation Function',ylab='CCF',xlab='Lag (k)'))
dev.off()
load(file='createtable')
a<-table.start()
a<-table.row.start(a)
a<-table.element(a,'Cross Correlation Function',2,TRUE)
a<-table.row.end(a)
a<-table.row.start(a)
a<-table.element(a,'Parameter',header=TRUE)
a<-table.element(a,'Value',header=TRUE)
a<-table.row.end(a)
a<-table.row.start(a)
a<-table.element(a,'Box-Cox transformation parameter (lambda) of X series',header=TRUE)
a<-table.element(a,par1)
a<-table.row.end(a)
a<-table.row.start(a)
a<-table.element(a,'Degree of non-seasonal differencing (d) of X series',header=TRUE)
a<-table.element(a,par2)
a<-table.row.end(a)
a<-table.row.start(a)
a<-table.element(a,'Degree of seasonal differencing (D) of X series',header=TRUE)
a<-table.element(a,par3)
a<-table.row.end(a)
a<-table.row.start(a)
a<-table.element(a,'Seasonal Period (s)',header=TRUE)
a<-table.element(a,par4)
a<-table.row.end(a)
a<-table.row.start(a)
a<-table.element(a,'Box-Cox transformation parameter (lambda) of Y series',header=TRUE)
a<-table.element(a,par5)
a<-table.row.end(a)
a<-table.row.start(a)
a<-table.element(a,'Degree of non-seasonal differencing (d) of Y series',header=TRUE)
a<-table.element(a,par6)
a<-table.row.end(a)
a<-table.row.start(a)
a<-table.element(a,'Degree of seasonal differencing (D) of Y series',header=TRUE)
a<-table.element(a,par7)
a<-table.row.end(a)
a<-table.row.start(a)
a<-table.element(a,'k',header=TRUE)
a<-table.element(a,'rho(Y[t],X[t+k])',header=TRUE)
a<-table.row.end(a)
mylength <- length(r$acf)
myhalf <- floor((mylength-1)/2)
for (i in 1:mylength) {
a<-table.row.start(a)
a<-table.element(a,i-myhalf-1,header=TRUE)
a<-table.element(a,r$acf[i])
a<-table.row.end(a)
}
a<-table.end(a)
table.save(a,file='mytable.tab')