Free Statistics

of Irreproducible Research!

Author's title

Author*The author of this computation has been verified*
R Software Modulerwasp_autocorrelation.wasp
Title produced by software(Partial) Autocorrelation Function
Date of computationThu, 01 Feb 2018 12:05:18 +0100
Cite this page as followsStatistical Computations at FreeStatistics.org, Office for Research Development and Education, URL https://freestatistics.org/blog/index.php?v=date/2018/Feb/01/t1517483134ae6phb6nwaj7mw9.htm/, Retrieved Sun, 28 Apr 2024 22:03:19 +0000
Statistical Computations at FreeStatistics.org, Office for Research Development and Education, URL https://freestatistics.org/blog/index.php?pk=314958, Retrieved Sun, 28 Apr 2024 22:03:19 +0000
QR Codes:

Original text written by user:
IsPrivate?No (this computation is public)
User-defined keywords
Estimated Impact36
Family? (F = Feedback message, R = changed R code, M = changed R Module, P = changed Parameters, D = changed Data)
-       [(Partial) Autocorrelation Function] [] [2018-02-01 11:05:18] [bc0a1b24d4c8c5bd2fad05813077f37f] [Current]
Feedback Forum

Post a new message
Dataseries X:
97.7
88.9
96.5
89.5
85.4
84.3
83.7
86.2
90.7
95.7
95.6
97
97.2
86.6
88.4
81.4
86.9
84.9
83.7
86.8
88.3
92.5
94.7
94.5
98.7
88.6
95.2
91.3
91.7
89.3
88.7
91.2
88.6
94.6
96
94.3
102
93.4
96.7
93.7
91.6
89.6
92.9
94.1
92
97.5
92.7
100.7
105.9
95.3
99.8
91.3
90.8
87.1
91.4
86.1
87.1
92.6
96.6
105.3
102.4
98.2
98.6
92.6
87.9
84.1
86.7
84.4
86
90.4
92.9
105.8
106
99.1
99.9
88.1
87.8
87.1
85.9
86.5
84.1
92.1
93.3
98.9
103
98.4
100.7
92.3
89
88.9
85.5
90.1
87
97.1
101.5
103
106.1
96.1
94.2
89.1
85.2
86.5
88
88.4
87.9
95.7
94.8
105.2
108.7
96.1
98.3
88.6
90.8
88.1
91.9
98.5
98.6
100.3
98.7
110.7
115.4
105.4
108
94.5
96.5
91
94.1
96.4
93.1
97.5
102.5
105.7
109.1
97.2
100.3
91.3
94.3
89.5
89.3
93.4
91.9
92.9
93.7
100.1
105.5
110.5
89.5
90.4
89.9
84.6
86.2
83.4
82.9
81.8
87.6
94.6
99.6
96.7
99.8
83.8
82.4
86.8
91
85.3
83.6
94
100.3
107.1
100.7
95.5
92.9
79.2
82
79.3
81.5
76
73.1
80.4
82.1
90.5
98.1
89.5
86.5
77
74.7
73.4
72.5
69.3
75.2
83.5
90.5
92.2
110.5
101.8
107.4
95.5
84.5
81.1
86.2
91.5
84.7
92.2
99.2
104.5
113
100.4
101
84.8
86.5
91.7
94.8
95


Summary of computational transaction
Raw Input view raw input (R code)
Raw Outputview raw output of R engine
Computing time1 seconds
R ServerBig Analytics Cloud Computing Center

\begin{tabular}{lllllllll}
\hline
Summary of computational transaction \tabularnewline
Raw Input view raw input (R code)  \tabularnewline
Raw Outputview raw output of R engine  \tabularnewline
Computing time1 seconds \tabularnewline
R ServerBig Analytics Cloud Computing Center \tabularnewline
\hline
\end{tabular}
%Source: https://freestatistics.org/blog/index.php?pk=314958&T=0

[TABLE]
[ROW]
Summary of computational transaction[/C][/ROW] [ROW]Raw Input[/C] view raw input (R code) [/C][/ROW] [ROW]Raw Output[/C]view raw output of R engine [/C][/ROW] [ROW]Computing time[/C]1 seconds[/C][/ROW] [ROW]R Server[/C]Big Analytics Cloud Computing Center[/C][/ROW] [/TABLE] Source: https://freestatistics.org/blog/index.php?pk=314958&T=0

Globally Unique Identifier (entire table): ba.freestatistics.org/blog/index.php?pk=314958&T=0

As an alternative you can also use a QR Code:  

The GUIDs for individual cells are displayed in the table below:

Summary of computational transaction
Raw Input view raw input (R code)
Raw Outputview raw output of R engine
Computing time1 seconds
R ServerBig Analytics Cloud Computing Center


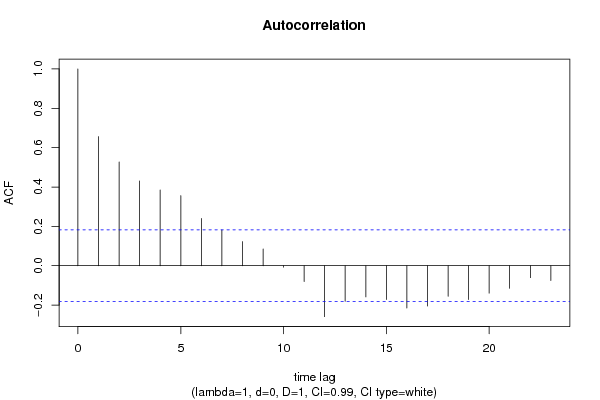
Autocorrelation Function
Time lag kACF(k)T-STATP-value
10.6563089.28160
20.5274827.45970
30.4302696.08490
40.384635.43950
50.3561445.03661e-06
60.2402673.39790.00041
70.1815112.5670.005495
80.1225641.73330.04229
90.0848711.20030.11573
10-0.007026-0.09940.460476
11-0.079827-1.12890.130142
12-0.258756-3.65940.000162
13-0.180234-2.54890.005778
14-0.158397-2.24010.013093
15-0.171915-2.43120.007964
16-0.21489-3.0390.001345
17-0.204755-2.89570.002102
18-0.155089-2.19330.01472
19-0.171324-2.42290.008144
20-0.139293-1.96990.025115
21-0.114304-1.61650.05378
22-0.060492-0.85550.196653
23-0.074947-1.05990.14523

\begin{tabular}{lllllllll}
\hline
Autocorrelation Function \tabularnewline
Time lag k & ACF(k) & T-STAT & P-value \tabularnewline
1 & 0.656308 & 9.2816 & 0 \tabularnewline
2 & 0.527482 & 7.4597 & 0 \tabularnewline
3 & 0.430269 & 6.0849 & 0 \tabularnewline
4 & 0.38463 & 5.4395 & 0 \tabularnewline
5 & 0.356144 & 5.0366 & 1e-06 \tabularnewline
6 & 0.240267 & 3.3979 & 0.00041 \tabularnewline
7 & 0.181511 & 2.567 & 0.005495 \tabularnewline
8 & 0.122564 & 1.7333 & 0.04229 \tabularnewline
9 & 0.084871 & 1.2003 & 0.11573 \tabularnewline
10 & -0.007026 & -0.0994 & 0.460476 \tabularnewline
11 & -0.079827 & -1.1289 & 0.130142 \tabularnewline
12 & -0.258756 & -3.6594 & 0.000162 \tabularnewline
13 & -0.180234 & -2.5489 & 0.005778 \tabularnewline
14 & -0.158397 & -2.2401 & 0.013093 \tabularnewline
15 & -0.171915 & -2.4312 & 0.007964 \tabularnewline
16 & -0.21489 & -3.039 & 0.001345 \tabularnewline
17 & -0.204755 & -2.8957 & 0.002102 \tabularnewline
18 & -0.155089 & -2.1933 & 0.01472 \tabularnewline
19 & -0.171324 & -2.4229 & 0.008144 \tabularnewline
20 & -0.139293 & -1.9699 & 0.025115 \tabularnewline
21 & -0.114304 & -1.6165 & 0.05378 \tabularnewline
22 & -0.060492 & -0.8555 & 0.196653 \tabularnewline
23 & -0.074947 & -1.0599 & 0.14523 \tabularnewline
\hline
\end{tabular}
%Source: https://freestatistics.org/blog/index.php?pk=314958&T=1

[TABLE]
[ROW][C]Autocorrelation Function[/C][/ROW]
[ROW][C]Time lag k[/C][C]ACF(k)[/C][C]T-STAT[/C][C]P-value[/C][/ROW]
[ROW][C]1[/C][C]0.656308[/C][C]9.2816[/C][C]0[/C][/ROW]
[ROW][C]2[/C][C]0.527482[/C][C]7.4597[/C][C]0[/C][/ROW]
[ROW][C]3[/C][C]0.430269[/C][C]6.0849[/C][C]0[/C][/ROW]
[ROW][C]4[/C][C]0.38463[/C][C]5.4395[/C][C]0[/C][/ROW]
[ROW][C]5[/C][C]0.356144[/C][C]5.0366[/C][C]1e-06[/C][/ROW]
[ROW][C]6[/C][C]0.240267[/C][C]3.3979[/C][C]0.00041[/C][/ROW]
[ROW][C]7[/C][C]0.181511[/C][C]2.567[/C][C]0.005495[/C][/ROW]
[ROW][C]8[/C][C]0.122564[/C][C]1.7333[/C][C]0.04229[/C][/ROW]
[ROW][C]9[/C][C]0.084871[/C][C]1.2003[/C][C]0.11573[/C][/ROW]
[ROW][C]10[/C][C]-0.007026[/C][C]-0.0994[/C][C]0.460476[/C][/ROW]
[ROW][C]11[/C][C]-0.079827[/C][C]-1.1289[/C][C]0.130142[/C][/ROW]
[ROW][C]12[/C][C]-0.258756[/C][C]-3.6594[/C][C]0.000162[/C][/ROW]
[ROW][C]13[/C][C]-0.180234[/C][C]-2.5489[/C][C]0.005778[/C][/ROW]
[ROW][C]14[/C][C]-0.158397[/C][C]-2.2401[/C][C]0.013093[/C][/ROW]
[ROW][C]15[/C][C]-0.171915[/C][C]-2.4312[/C][C]0.007964[/C][/ROW]
[ROW][C]16[/C][C]-0.21489[/C][C]-3.039[/C][C]0.001345[/C][/ROW]
[ROW][C]17[/C][C]-0.204755[/C][C]-2.8957[/C][C]0.002102[/C][/ROW]
[ROW][C]18[/C][C]-0.155089[/C][C]-2.1933[/C][C]0.01472[/C][/ROW]
[ROW][C]19[/C][C]-0.171324[/C][C]-2.4229[/C][C]0.008144[/C][/ROW]
[ROW][C]20[/C][C]-0.139293[/C][C]-1.9699[/C][C]0.025115[/C][/ROW]
[ROW][C]21[/C][C]-0.114304[/C][C]-1.6165[/C][C]0.05378[/C][/ROW]
[ROW][C]22[/C][C]-0.060492[/C][C]-0.8555[/C][C]0.196653[/C][/ROW]
[ROW][C]23[/C][C]-0.074947[/C][C]-1.0599[/C][C]0.14523[/C][/ROW]
[/TABLE]
Source: https://freestatistics.org/blog/index.php?pk=314958&T=1

Globally Unique Identifier (entire table): ba.freestatistics.org/blog/index.php?pk=314958&T=1

As an alternative you can also use a QR Code:  

The GUIDs for individual cells are displayed in the table below:

Autocorrelation Function
Time lag kACF(k)T-STATP-value
10.6563089.28160
20.5274827.45970
30.4302696.08490
40.384635.43950
50.3561445.03661e-06
60.2402673.39790.00041
70.1815112.5670.005495
80.1225641.73330.04229
90.0848711.20030.11573
10-0.007026-0.09940.460476
11-0.079827-1.12890.130142
12-0.258756-3.65940.000162
13-0.180234-2.54890.005778
14-0.158397-2.24010.013093
15-0.171915-2.43120.007964
16-0.21489-3.0390.001345
17-0.204755-2.89570.002102
18-0.155089-2.19330.01472
19-0.171324-2.42290.008144
20-0.139293-1.96990.025115
21-0.114304-1.61650.05378
22-0.060492-0.85550.196653
23-0.074947-1.05990.14523


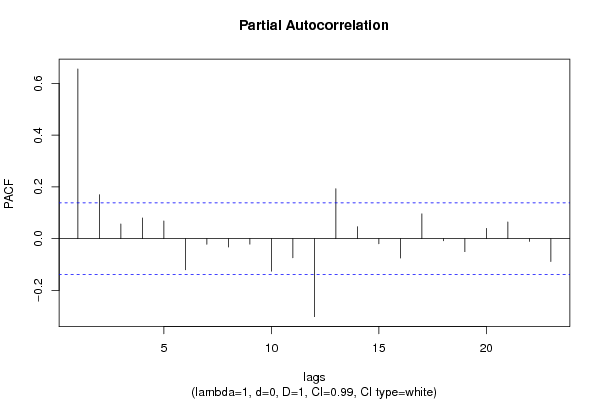
Partial Autocorrelation Function
Time lag kPACF(k)T-STATP-value
10.6563089.28160
20.1699432.40340.008579
30.0567570.80270.211559
40.0794851.12410.131162
50.068160.96390.168122
6-0.120325-1.70160.045188
7-0.021663-0.30640.379825
8-0.032833-0.46430.321459
9-0.021364-0.30210.381433
10-0.125745-1.77830.038437
11-0.07382-1.0440.14888
12-0.301925-4.26991.5e-05
130.1927172.72540.003496
140.0457530.6470.259173
15-0.020057-0.28370.388486
16-0.075118-1.06230.144683
170.0956961.35330.088736
18-0.008665-0.12250.451298
19-0.050554-0.71490.23774
200.0394670.55810.288685
210.0645340.91270.181261
22-0.010869-0.15370.438996
23-0.088566-1.25250.105923

\begin{tabular}{lllllllll}
\hline
Partial Autocorrelation Function \tabularnewline
Time lag k & PACF(k) & T-STAT & P-value \tabularnewline
1 & 0.656308 & 9.2816 & 0 \tabularnewline
2 & 0.169943 & 2.4034 & 0.008579 \tabularnewline
3 & 0.056757 & 0.8027 & 0.211559 \tabularnewline
4 & 0.079485 & 1.1241 & 0.131162 \tabularnewline
5 & 0.06816 & 0.9639 & 0.168122 \tabularnewline
6 & -0.120325 & -1.7016 & 0.045188 \tabularnewline
7 & -0.021663 & -0.3064 & 0.379825 \tabularnewline
8 & -0.032833 & -0.4643 & 0.321459 \tabularnewline
9 & -0.021364 & -0.3021 & 0.381433 \tabularnewline
10 & -0.125745 & -1.7783 & 0.038437 \tabularnewline
11 & -0.07382 & -1.044 & 0.14888 \tabularnewline
12 & -0.301925 & -4.2699 & 1.5e-05 \tabularnewline
13 & 0.192717 & 2.7254 & 0.003496 \tabularnewline
14 & 0.045753 & 0.647 & 0.259173 \tabularnewline
15 & -0.020057 & -0.2837 & 0.388486 \tabularnewline
16 & -0.075118 & -1.0623 & 0.144683 \tabularnewline
17 & 0.095696 & 1.3533 & 0.088736 \tabularnewline
18 & -0.008665 & -0.1225 & 0.451298 \tabularnewline
19 & -0.050554 & -0.7149 & 0.23774 \tabularnewline
20 & 0.039467 & 0.5581 & 0.288685 \tabularnewline
21 & 0.064534 & 0.9127 & 0.181261 \tabularnewline
22 & -0.010869 & -0.1537 & 0.438996 \tabularnewline
23 & -0.088566 & -1.2525 & 0.105923 \tabularnewline
\hline
\end{tabular}
%Source: https://freestatistics.org/blog/index.php?pk=314958&T=2

[TABLE]
[ROW][C]Partial Autocorrelation Function[/C][/ROW]
[ROW][C]Time lag k[/C][C]PACF(k)[/C][C]T-STAT[/C][C]P-value[/C][/ROW]
[ROW][C]1[/C][C]0.656308[/C][C]9.2816[/C][C]0[/C][/ROW]
[ROW][C]2[/C][C]0.169943[/C][C]2.4034[/C][C]0.008579[/C][/ROW]
[ROW][C]3[/C][C]0.056757[/C][C]0.8027[/C][C]0.211559[/C][/ROW]
[ROW][C]4[/C][C]0.079485[/C][C]1.1241[/C][C]0.131162[/C][/ROW]
[ROW][C]5[/C][C]0.06816[/C][C]0.9639[/C][C]0.168122[/C][/ROW]
[ROW][C]6[/C][C]-0.120325[/C][C]-1.7016[/C][C]0.045188[/C][/ROW]
[ROW][C]7[/C][C]-0.021663[/C][C]-0.3064[/C][C]0.379825[/C][/ROW]
[ROW][C]8[/C][C]-0.032833[/C][C]-0.4643[/C][C]0.321459[/C][/ROW]
[ROW][C]9[/C][C]-0.021364[/C][C]-0.3021[/C][C]0.381433[/C][/ROW]
[ROW][C]10[/C][C]-0.125745[/C][C]-1.7783[/C][C]0.038437[/C][/ROW]
[ROW][C]11[/C][C]-0.07382[/C][C]-1.044[/C][C]0.14888[/C][/ROW]
[ROW][C]12[/C][C]-0.301925[/C][C]-4.2699[/C][C]1.5e-05[/C][/ROW]
[ROW][C]13[/C][C]0.192717[/C][C]2.7254[/C][C]0.003496[/C][/ROW]
[ROW][C]14[/C][C]0.045753[/C][C]0.647[/C][C]0.259173[/C][/ROW]
[ROW][C]15[/C][C]-0.020057[/C][C]-0.2837[/C][C]0.388486[/C][/ROW]
[ROW][C]16[/C][C]-0.075118[/C][C]-1.0623[/C][C]0.144683[/C][/ROW]
[ROW][C]17[/C][C]0.095696[/C][C]1.3533[/C][C]0.088736[/C][/ROW]
[ROW][C]18[/C][C]-0.008665[/C][C]-0.1225[/C][C]0.451298[/C][/ROW]
[ROW][C]19[/C][C]-0.050554[/C][C]-0.7149[/C][C]0.23774[/C][/ROW]
[ROW][C]20[/C][C]0.039467[/C][C]0.5581[/C][C]0.288685[/C][/ROW]
[ROW][C]21[/C][C]0.064534[/C][C]0.9127[/C][C]0.181261[/C][/ROW]
[ROW][C]22[/C][C]-0.010869[/C][C]-0.1537[/C][C]0.438996[/C][/ROW]
[ROW][C]23[/C][C]-0.088566[/C][C]-1.2525[/C][C]0.105923[/C][/ROW]
[/TABLE]
Source: https://freestatistics.org/blog/index.php?pk=314958&T=2

Globally Unique Identifier (entire table): ba.freestatistics.org/blog/index.php?pk=314958&T=2

As an alternative you can also use a QR Code:  

The GUIDs for individual cells are displayed in the table below:

Partial Autocorrelation Function
Time lag kPACF(k)T-STATP-value
10.6563089.28160
20.1699432.40340.008579
30.0567570.80270.211559
40.0794851.12410.131162
50.068160.96390.168122
6-0.120325-1.70160.045188
7-0.021663-0.30640.379825
8-0.032833-0.46430.321459
9-0.021364-0.30210.381433
10-0.125745-1.77830.038437
11-0.07382-1.0440.14888
12-0.301925-4.26991.5e-05
130.1927172.72540.003496
140.0457530.6470.259173
15-0.020057-0.28370.388486
16-0.075118-1.06230.144683
170.0956961.35330.088736
18-0.008665-0.12250.451298
19-0.050554-0.71490.23774
200.0394670.55810.288685
210.0645340.91270.181261
22-0.010869-0.15370.438996
23-0.088566-1.25250.105923


Parameters (Session):
Parameters (R input):
par1 = Default ; par2 = 1 ; par3 = 0 ; par4 = 1 ; par5 = 12 ; par6 = White Noise ; par7 = 0.99 ; par8 = ;
R code (references can be found in the software module):
par8 <- ''
par7 <- '0.95'
par6 <- 'White Noise'
par5 <- '12'
par4 <- '1'
par3 <- '0'
par2 <- '1'
par1 <- 'Default'
if (par1 == 'Default') {
par1 = 10*log10(length(x))
} else {
par1 <- as.numeric(par1)
}
par2 <- as.numeric(par2)
par3 <- as.numeric(par3)
par4 <- as.numeric(par4)
par5 <- as.numeric(par5)
if (par6 == 'White Noise') par6 <- 'white' else par6 <- 'ma'
par7 <- as.numeric(par7)
if (par8 != '') par8 <- as.numeric(par8)
x <- na.omit(x)
ox <- x
if (par8 == '') {
if (par2 == 0) {
x <- log(x)
} else {
x <- (x ^ par2 - 1) / par2
}
} else {
x <- log(x,base=par8)
}
if (par3 > 0) x <- diff(x,lag=1,difference=par3)
if (par4 > 0) x <- diff(x,lag=par5,difference=par4)
bitmap(file='picts.png')
op <- par(mfrow=c(2,1))
plot(ox,type='l',main='Original Time Series',xlab='time',ylab='value')
if (par8=='') {
mytitle <- paste('Working Time Series (lambda=',par2,', d=',par3,', D=',par4,')',sep='')
mysub <- paste('(lambda=',par2,', d=',par3,', D=',par4,', CI=', par7, ', CI type=',par6,')',sep='')
} else {
mytitle <- paste('Working Time Series (base=',par8,', d=',par3,', D=',par4,')',sep='')
mysub <- paste('(base=',par8,', d=',par3,', D=',par4,', CI=', par7, ', CI type=',par6,')',sep='')
}
plot(x,type='l', main=mytitle,xlab='time',ylab='value')
par(op)
dev.off()
bitmap(file='pic1.png')
racf <- acf(x, par1, main='Autocorrelation', xlab='time lag', ylab='ACF', ci.type=par6, ci=par7, sub=mysub)
dev.off()
bitmap(file='pic2.png')
rpacf <- pacf(x,par1,main='Partial Autocorrelation',xlab='lags',ylab='PACF',sub=mysub)
dev.off()
(myacf <- c(racf$acf))
(mypacf <- c(rpacf$acf))
lengthx <- length(x)
sqrtn <- sqrt(lengthx)
load(file='createtable')
a<-table.start()
a<-table.row.start(a)
a<-table.element(a,'Autocorrelation Function',4,TRUE)
a<-table.row.end(a)
a<-table.row.start(a)
a<-table.element(a,'Time lag k',header=TRUE)
a<-table.element(a,'ACF(k)',header=TRUE)
a<-table.element(a,'T-STAT',header=TRUE)
a<-table.element(a,'P-value',header=TRUE)
a<-table.row.end(a)
for (i in 2:(par1+1)) {
a<-table.row.start(a)
a<-table.element(a,i-1,header=TRUE)
a<-table.element(a,round(myacf[i],6))
mytstat <- myacf[i]*sqrtn
a<-table.element(a,round(mytstat,4))
a<-table.element(a,round(1-pt(abs(mytstat),lengthx),6))
a<-table.row.end(a)
}
a<-table.end(a)
table.save(a,file='mytable.tab')
a<-table.start()
a<-table.row.start(a)
a<-table.element(a,'Partial Autocorrelation Function',4,TRUE)
a<-table.row.end(a)
a<-table.row.start(a)
a<-table.element(a,'Time lag k',header=TRUE)
a<-table.element(a,'PACF(k)',header=TRUE)
a<-table.element(a,'T-STAT',header=TRUE)
a<-table.element(a,'P-value',header=TRUE)
a<-table.row.end(a)
for (i in 1:par1) {
a<-table.row.start(a)
a<-table.element(a,i,header=TRUE)
a<-table.element(a,round(mypacf[i],6))
mytstat <- mypacf[i]*sqrtn
a<-table.element(a,round(mytstat,4))
a<-table.element(a,round(1-pt(abs(mytstat),lengthx),6))
a<-table.row.end(a)
}
a<-table.end(a)
table.save(a,file='mytable1.tab')