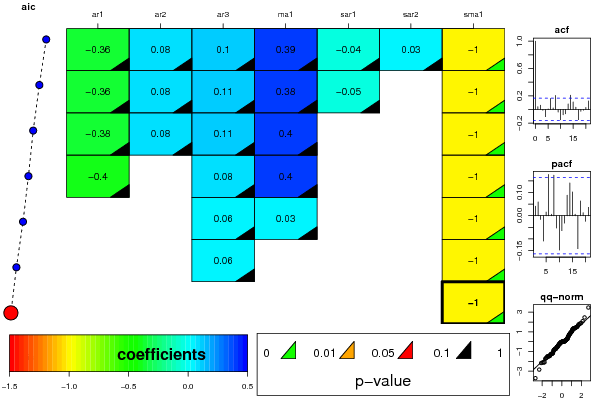
| ARIMA Parameter Estimation and Backward Selection | |||||||
| Iteration | ar1 | ar2 | ar3 | ma1 | sar1 | sar2 | sma1 |
| Estimates ( 1 ) | -0.3562 | 0.0782 | 0.1036 | 0.387 | -0.0418 | 0.026 | -1 |
| (p-val) | (0.371 ) | (0.4046 ) | (0.245 ) | (0.3238 ) | (0.6678 ) | (0.8008 ) | (0 ) |
| Estimates ( 2 ) | -0.355 | 0.0755 | 0.1058 | 0.3817 | -0.0477 | 0 | -1 |
| (p-val) | (0.3662 ) | (0.4165 ) | (0.2321 ) | (0.3236 ) | (0.6133 ) | (NA ) | (0 ) |
| Estimates ( 3 ) | -0.378 | 0.0753 | 0.1071 | 0.4049 | 0 | 0 | -1 |
| (p-val) | (0.3165 ) | (0.4212 ) | (0.2253 ) | (0.2747 ) | (NA ) | (NA ) | (0 ) |
| Estimates ( 4 ) | -0.3953 | 0 | 0.0825 | 0.3977 | 0 | 0 | -1 |
| (p-val) | (0.3388 ) | (NA ) | (0.3202 ) | (0.3022 ) | (NA ) | (NA ) | (0 ) |
| Estimates ( 5 ) | 0 | 0 | 0.0599 | 0.0304 | 0 | 0 | -1 |
| (p-val) | (NA ) | (NA ) | (0.4947 ) | (0.7128 ) | (NA ) | (NA ) | (0 ) |
| Estimates ( 6 ) | 0 | 0 | 0.0584 | 0 | 0 | 0 | -1 |
| (p-val) | (NA ) | (NA ) | (0.5045 ) | (NA ) | (NA ) | (NA ) | (0 ) |
| Estimates ( 7 ) | 0 | 0 | 0 | 0 | 0 | 0 | -1 |
| (p-val) | (NA ) | (NA ) | (NA ) | (NA ) | (NA ) | (NA ) | (0 ) |
| Estimates ( 8 ) | NA | NA | NA | NA | NA | NA | NA |
| (p-val) | (NA ) | (NA ) | (NA ) | (NA ) | (NA ) | (NA ) | (NA ) |
| Estimates ( 9 ) | NA | NA | NA | NA | NA | NA | NA |
| (p-val) | (NA ) | (NA ) | (NA ) | (NA ) | (NA ) | (NA ) | (NA ) |
| Estimates ( 10 ) | NA | NA | NA | NA | NA | NA | NA |
| (p-val) | (NA ) | (NA ) | (NA ) | (NA ) | (NA ) | (NA ) | (NA ) |
| Estimates ( 11 ) | NA | NA | NA | NA | NA | NA | NA |
| (p-val) | (NA ) | (NA ) | (NA ) | (NA ) | (NA ) | (NA ) | (NA ) |
| Estimates ( 12 ) | NA | NA | NA | NA | NA | NA | NA |
| (p-val) | (NA ) | (NA ) | (NA ) | (NA ) | (NA ) | (NA ) | (NA ) |
| Estimates ( 13 ) | NA | NA | NA | NA | NA | NA | NA |
| (p-val) | (NA ) | (NA ) | (NA ) | (NA ) | (NA ) | (NA ) | (NA ) |
| Menu of Residual Diagnostics | |
| Description | Link |
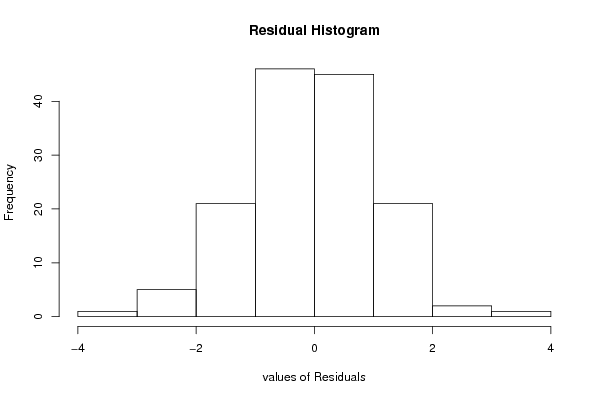
| Histogram | Compute |
| Central Tendency | Compute |
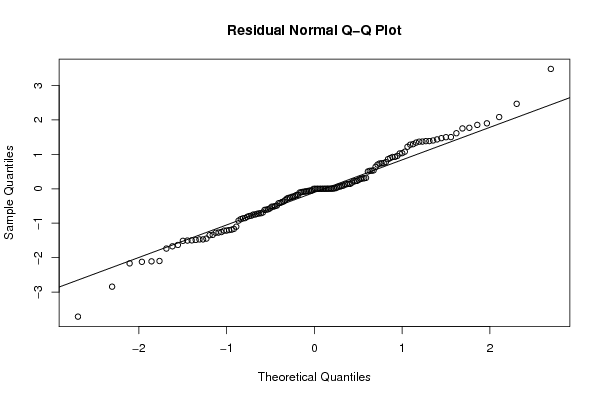
| QQ Plot | Compute |
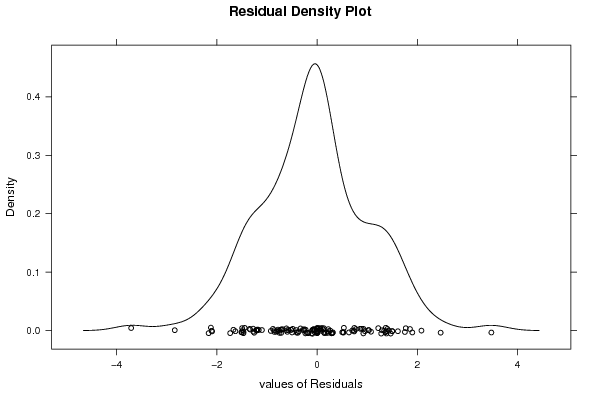
| Kernel Density Plot | Compute |
| Skewness/Kurtosis Test | Compute |
| Skewness-Kurtosis Plot | Compute |
| Harrell-Davis Plot | Compute |
| Bootstrap Plot -- Central Tendency | Compute |
| Blocked Bootstrap Plot -- Central Tendency | Compute |
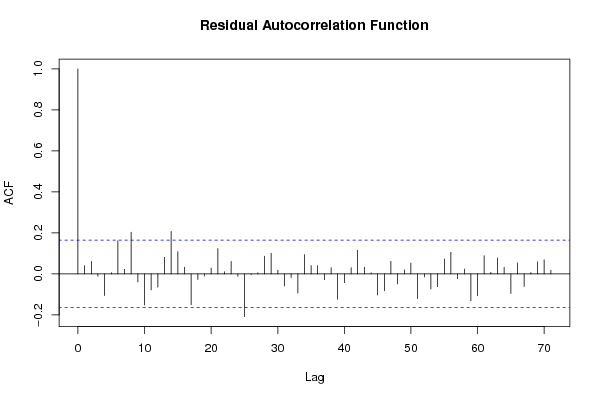
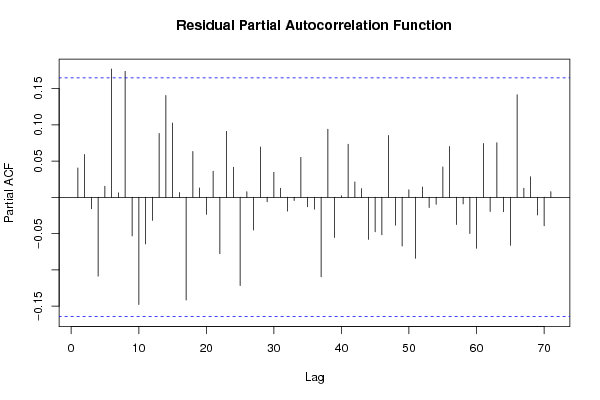
| (Partial) Autocorrelation Plot | Compute |
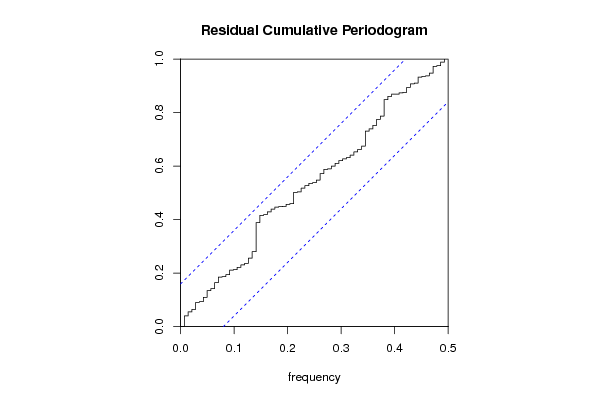
| Spectral Analysis | Compute |
| Tukey lambda PPCC Plot | Compute |
| Box-Cox Normality Plot | Compute |
| Summary Statistics | Compute |