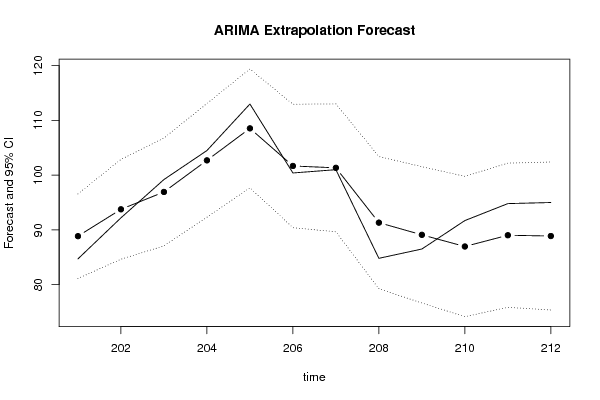
| Univariate ARIMA Extrapolation Forecast | ||||||||
| time | Y[t] | F[t] | 95% LB | 95% UB | p-value (H0: Y[t] = F[t]) | P(F[t]>Y[t-1]) | P(F[t]>Y[t-s]) | P(F[t]>Y[200]) |
| 188 | 69.3 | - | - | - | - | - | - | - |
| 189 | 75.2 | - | - | - | - | - | - | - |
| 190 | 83.5 | - | - | - | - | - | - | - |
| 191 | 90.5 | - | - | - | - | - | - | - |
| 192 | 92.2 | - | - | - | - | - | - | - |
| 193 | 110.5 | - | - | - | - | - | - | - |
| 194 | 101.8 | - | - | - | - | - | - | - |
| 195 | 107.4 | - | - | - | - | - | - | - |
| 196 | 95.5 | - | - | - | - | - | - | - |
| 197 | 84.5 | - | - | - | - | - | - | - |
| 198 | 81.1 | - | - | - | - | - | - | - |
| 199 | 86.2 | - | - | - | - | - | - | - |
| 200 | 91.5 | - | - | - | - | - | - | - |
| 201 | 84.7 | 88.8504 | 81.1233 | 96.5775 | 0.1462 | 0.2508 | 0.9997 | 0.2508 |
| 202 | 92.2 | 93.7561 | 84.6359 | 102.8762 | 0.369 | 0.9742 | 0.9862 | 0.6861 |
| 203 | 99.2 | 96.928 | 87.0732 | 106.7828 | 0.3257 | 0.8265 | 0.8995 | 0.8598 |
| 204 | 104.5 | 102.7044 | 92.3099 | 113.0988 | 0.3675 | 0.7456 | 0.9762 | 0.9827 |
| 205 | 113 | 108.5535 | 97.695 | 119.4119 | 0.2111 | 0.7678 | 0.3627 | 0.999 |
| 206 | 100.4 | 101.6778 | 90.3917 | 112.9638 | 0.4122 | 0.0246 | 0.4915 | 0.9614 |
| 207 | 101 | 101.3379 | 89.6464 | 113.0294 | 0.4774 | 0.5625 | 0.1548 | 0.9505 |
| 208 | 84.8 | 91.3205 | 79.2394 | 103.4015 | 0.1451 | 0.0582 | 0.2489 | 0.4884 |
| 209 | 86.5 | 89.0915 | 76.634 | 101.549 | 0.3417 | 0.7502 | 0.765 | 0.3524 |
| 210 | 91.7 | 86.9608 | 74.1382 | 99.7834 | 0.2344 | 0.5281 | 0.8148 | 0.2439 |
| 211 | 94.8 | 89.018 | 75.8406 | 102.1954 | 0.1949 | 0.345 | 0.6624 | 0.356 |
| 212 | 95 | 88.8757 | 75.3528 | 102.3986 | 0.1874 | 0.1953 | 0.3518 | 0.3518 |
| Univariate ARIMA Extrapolation Forecast Performance | |||||||||
| time | % S.E. | PE | MAPE | sMAPE | Sq.E | MSE | RMSE | ScaledE | MASE |
| 201 | 0.0444 | -0.049 | 0.049 | 0.0478 | 17.2257 | 0 | 0 | -0.6724 | 0.6724 |
| 202 | 0.0496 | -0.0169 | 0.0329 | 0.0323 | 2.4214 | 9.8236 | 3.1343 | -0.2521 | 0.4622 |
| 203 | 0.0519 | 0.0229 | 0.0296 | 0.0292 | 5.162 | 8.2697 | 2.8757 | 0.3681 | 0.4308 |
| 204 | 0.0516 | 0.0172 | 0.0265 | 0.0263 | 3.2244 | 7.0084 | 2.6473 | 0.2909 | 0.3959 |
| 205 | 0.051 | 0.0393 | 0.0291 | 0.029 | 19.7718 | 9.561 | 3.0921 | 0.7204 | 0.4608 |
| 206 | 0.0566 | -0.0127 | 0.0263 | 0.0263 | 1.6327 | 8.2397 | 2.8705 | -0.207 | 0.4185 |
| 207 | 0.0589 | -0.0033 | 0.0231 | 0.023 | 0.1142 | 7.0789 | 2.6606 | -0.0547 | 0.3665 |
| 208 | 0.0675 | -0.0769 | 0.0298 | 0.0294 | 42.5167 | 11.5086 | 3.3924 | -1.0563 | 0.4527 |
| 209 | 0.0713 | -0.03 | 0.0298 | 0.0294 | 6.716 | 10.9761 | 3.313 | -0.4198 | 0.4491 |
| 210 | 0.0752 | 0.0517 | 0.032 | 0.0318 | 22.4597 | 12.1245 | 3.482 | 0.7678 | 0.4809 |
| 211 | 0.0755 | 0.061 | 0.0346 | 0.0346 | 33.4313 | 14.0614 | 3.7499 | 0.9367 | 0.5224 |
| 212 | 0.0776 | 0.0645 | 0.0371 | 0.0373 | 37.507 | 16.0152 | 4.0019 | 0.9922 | 0.5615 |