| Multiple Linear Regression - Estimated Regression Equation |
| Intention_to_Use[t] = -1.6643 + 0.316148Relative_Advantage[t] + 0.105992Perceived_Usefulness[t] + 0.100152Perceived_Ease_of_Use[t] + 0.0338913Information_Quality[t] + 0.0733252System_Quality[t] + 0.87774groupB[t] + 0.283069genderB[t] -0.0145574`Intention_to_Use(t-1)`[t] + 0.0736481`Intention_to_Use(t-1s)`[t] + e[t] |
| Warning: you did not specify the column number of the endogenous series! The first column was selected by default. |
| Multiple Linear Regression - Ordinary Least Squares | |||||
| Variable | Parameter | S.D. | T-STAT H0: parameter = 0 | 2-tail p-value | 1-tail p-value |
| (Intercept) | -1.664 | 0.9235 | -1.8020e+00 | 0.07345 | 0.03673 |
| Relative_Advantage | +0.3161 | 0.06212 | +5.0890e+00 | 1.022e-06 | 5.112e-07 |
| Perceived_Usefulness | +0.106 | 0.06144 | +1.7250e+00 | 0.08651 | 0.04325 |
| Perceived_Ease_of_Use | +0.1002 | 0.05758 | +1.7390e+00 | 0.08397 | 0.04198 |
| Information_Quality | +0.03389 | 0.06477 | +5.2330e-01 | 0.6015 | 0.3008 |
| System_Quality | +0.07333 | 0.03014 | +2.4330e+00 | 0.01612 | 0.008061 |
| groupB | +0.8777 | 0.2522 | +3.4800e+00 | 0.0006499 | 0.0003249 |
| genderB | +0.2831 | 0.2183 | +1.2970e+00 | 0.1967 | 0.09836 |
| `Intention_to_Use(t-1)` | -0.01456 | 0.05437 | -2.6770e-01 | 0.7892 | 0.3946 |
| `Intention_to_Use(t-1s)` | +0.07365 | 0.05341 | +1.3790e+00 | 0.1699 | 0.08493 |
| Multiple Linear Regression - Regression Statistics | |
| Multiple R | 0.7592 |
| R-squared | 0.5764 |
| Adjusted R-squared | 0.552 |
| F-TEST (value) | 23.59 |
| F-TEST (DF numerator) | 9 |
| F-TEST (DF denominator) | 156 |
| p-value | 0 |
| Multiple Linear Regression - Residual Statistics | |
| Residual Standard Deviation | 1.317 |
| Sum Squared Residuals | 270.5 |
| Menu of Residual Diagnostics | |
| Description | Link |
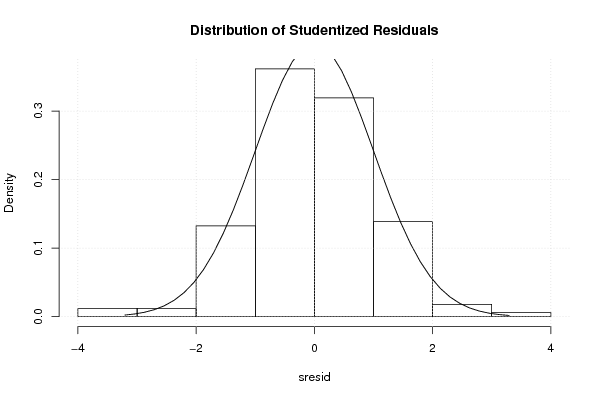
| Histogram | Compute |
| Central Tendency | Compute |
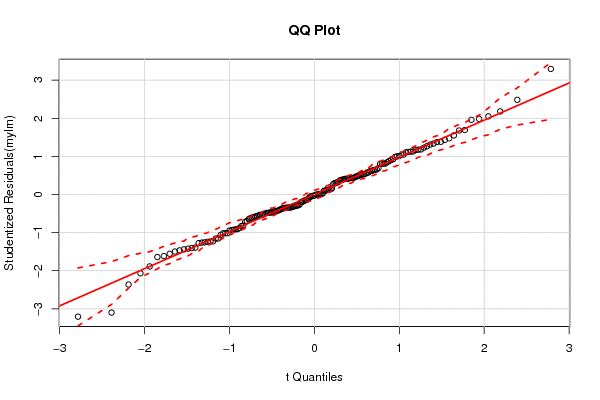
| QQ Plot | Compute |
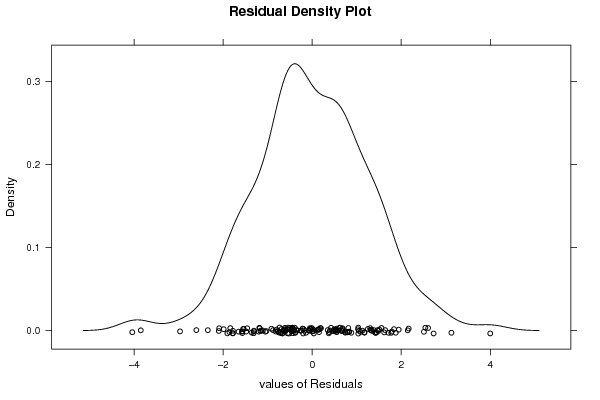
| Kernel Density Plot | Compute |
| Skewness/Kurtosis Test | Compute |
| Skewness-Kurtosis Plot | Compute |
| Harrell-Davis Plot | Compute |
| Bootstrap Plot -- Central Tendency | Compute |
| Blocked Bootstrap Plot -- Central Tendency | Compute |
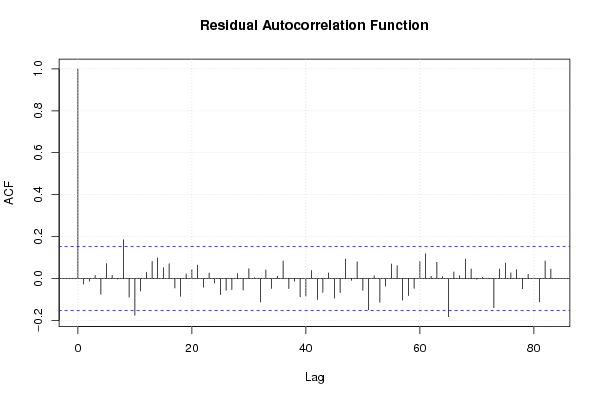
| (Partial) Autocorrelation Plot | Compute |
| Spectral Analysis | Compute |
| Tukey lambda PPCC Plot | Compute |
| Box-Cox Normality Plot | Compute |
| Summary Statistics | Compute |
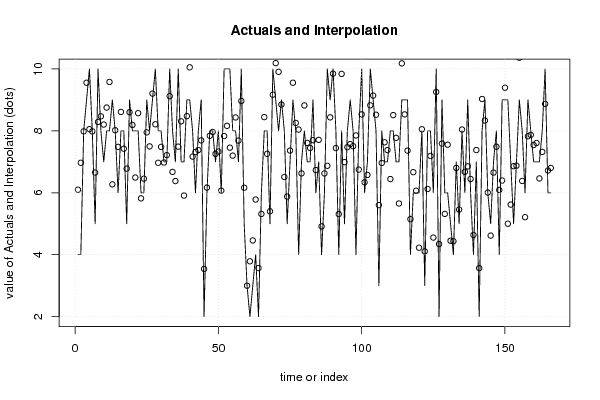
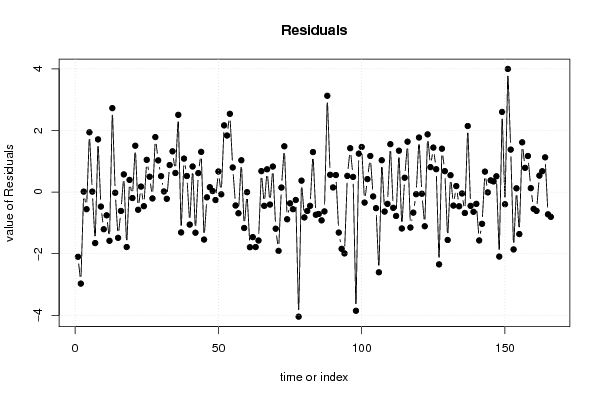
| Multiple Linear Regression - Actuals, Interpolation, and Residuals | |||
| Time or Index | Actuals | Interpolation Forecast | Residuals Prediction Error |
| 1 | 4 | 6.099 | -2.099 |
| 2 | 4 | 6.97 | -2.97 |
| 3 | 8 | 7.984 | 0.01627 |
| 4 | 9 | 9.555 | -0.5546 |
| 5 | 10 | 8.057 | 1.943 |
| 6 | 8 | 7.983 | 0.01696 |
| 7 | 5 | 6.653 | -1.653 |
| 8 | 10 | 8.288 | 1.712 |
| 9 | 8 | 8.47 | -0.4696 |
| 10 | 7 | 8.204 | -1.204 |
| 11 | 8 | 8.752 | -0.752 |
| 12 | 8 | 9.579 | -1.579 |
| 13 | 9 | 6.273 | 2.727 |
| 14 | 8 | 8.02 | -0.02047 |
| 15 | 6 | 7.484 | -1.484 |
| 16 | 8 | 8.611 | -0.6113 |
| 17 | 8 | 7.424 | 0.5756 |
| 18 | 5 | 6.782 | -1.782 |
| 19 | 9 | 8.602 | 0.3976 |
| 20 | 8 | 8.191 | -0.1915 |
| 21 | 8 | 6.493 | 1.507 |
| 22 | 8 | 8.572 | -0.5724 |
| 23 | 6 | 5.82 | 0.1796 |
| 24 | 6 | 6.456 | -0.4564 |
| 25 | 9 | 7.952 | 1.048 |
| 26 | 8 | 7.5 | 0.5001 |
| 27 | 9 | 9.205 | -0.2045 |
| 28 | 10 | 8.213 | 1.787 |
| 29 | 8 | 6.97 | 1.03 |
| 30 | 8 | 7.481 | 0.5186 |
| 31 | 7 | 6.978 | 0.02162 |
| 32 | 7 | 7.217 | -0.2175 |
| 33 | 10 | 9.121 | 0.8789 |
| 34 | 8 | 6.676 | 1.324 |
| 35 | 7 | 6.378 | 0.6216 |
| 36 | 10 | 7.49 | 2.51 |
| 37 | 7 | 8.308 | -1.308 |
| 38 | 7 | 5.911 | 1.089 |
| 39 | 9 | 8.476 | 0.5237 |
| 40 | 9 | 10.05 | -1.054 |
| 41 | 8 | 7.168 | 0.8321 |
| 42 | 6 | 7.317 | -1.317 |
| 43 | 8 | 7.382 | 0.6184 |
| 44 | 9 | 7.693 | 1.307 |
| 45 | 2 | 3.54 | -1.54 |
| 46 | 6 | 6.169 | -0.1688 |
| 47 | 8 | 7.84 | 0.16 |
| 48 | 8 | 7.965 | 0.03495 |
| 49 | 7 | 7.256 | -0.2563 |
| 50 | 8 | 7.33 | 0.6696 |
| 51 | 6 | 6.07 | -0.07044 |
| 52 | 10 | 7.833 | 2.167 |
| 53 | 10 | 8.162 | 1.838 |
| 54 | 10 | 7.457 | 2.543 |
| 55 | 8 | 7.2 | 0.8002 |
| 56 | 8 | 8.434 | -0.4336 |
| 57 | 7 | 7.685 | -0.6855 |
| 58 | 10 | 8.965 | 1.035 |
| 59 | 5 | 6.164 | -1.164 |
| 60 | 3 | 3 | -0.0004473 |
| 61 | 2 | 3.788 | -1.788 |
| 62 | 3 | 4.461 | -1.461 |
| 63 | 4 | 5.782 | -1.782 |
| 64 | 2 | 3.57 | -1.57 |
| 65 | 6 | 5.317 | 0.6827 |
| 66 | 8 | 8.444 | -0.444 |
| 67 | 8 | 7.258 | 0.7415 |
| 68 | 5 | 5.403 | -0.403 |
| 69 | 10 | 9.169 | 0.8306 |
| 70 | 9 | 10.19 | -1.188 |
| 71 | 8 | 9.907 | -1.907 |
| 72 | 9 | 8.851 | 0.1486 |
| 73 | 8 | 6.512 | 1.488 |
| 74 | 5 | 5.88 | -0.8803 |
| 75 | 7 | 7.364 | -0.3637 |
| 76 | 9 | 9.555 | -0.5546 |
| 77 | 8 | 8.255 | -0.2552 |
| 78 | 4 | 8.043 | -4.043 |
| 79 | 7 | 6.627 | 0.3729 |
| 80 | 8 | 8.821 | -0.8213 |
| 81 | 7 | 7.612 | -0.612 |
| 82 | 7 | 7.446 | -0.4462 |
| 83 | 9 | 7.699 | 1.301 |
| 84 | 6 | 6.734 | -0.7341 |
| 85 | 7 | 7.709 | -0.7092 |
| 86 | 4 | 4.916 | -0.9165 |
| 87 | 6 | 6.625 | -0.6255 |
| 88 | 10 | 6.873 | 3.127 |
| 89 | 9 | 8.437 | 0.5632 |
| 90 | 10 | 9.848 | 0.1525 |
| 91 | 8 | 7.445 | 0.555 |
| 92 | 4 | 5.312 | -1.312 |
| 93 | 8 | 9.841 | -1.841 |
| 94 | 5 | 6.989 | -1.989 |
| 95 | 8 | 7.473 | 0.5274 |
| 96 | 9 | 7.574 | 1.426 |
| 97 | 8 | 7.506 | 0.4941 |
| 98 | 4 | 7.852 | -3.852 |
| 99 | 8 | 6.749 | 1.251 |
| 100 | 10 | 8.534 | 1.466 |
| 101 | 6 | 6.339 | -0.3393 |
| 102 | 7 | 6.577 | 0.4232 |
| 103 | 10 | 8.826 | 1.174 |
| 104 | 9 | 9.14 | -0.1403 |
| 105 | 8 | 8.52 | -0.5204 |
| 106 | 3 | 5.603 | -2.603 |
| 107 | 8 | 6.964 | 1.036 |
| 108 | 7 | 7.631 | -0.6314 |
| 109 | 7 | 7.381 | -0.3806 |
| 110 | 8 | 6.444 | 1.556 |
| 111 | 8 | 8.51 | -0.5097 |
| 112 | 7 | 7.774 | -0.7737 |
| 113 | 7 | 5.655 | 1.345 |
| 114 | 9 | 10.18 | -1.18 |
| 115 | 9 | 8.533 | 0.4674 |
| 116 | 9 | 7.362 | 1.638 |
| 117 | 4 | 5.149 | -1.149 |
| 118 | 6 | 6.666 | -0.6659 |
| 119 | 6 | 6.067 | -0.06733 |
| 120 | 6 | 4.226 | 1.774 |
| 121 | 8 | 8.052 | -0.05212 |
| 122 | 3 | 4.108 | -1.108 |
| 123 | 8 | 6.125 | 1.875 |
| 124 | 8 | 7.189 | 0.8108 |
| 125 | 6 | 4.553 | 1.447 |
| 126 | 10 | 9.256 | 0.7437 |
| 127 | 2 | 4.345 | -2.345 |
| 128 | 9 | 7.59 | 1.41 |
| 129 | 6 | 5.318 | 0.6815 |
| 130 | 6 | 7.553 | -1.553 |
| 131 | 5 | 4.451 | 0.5488 |
| 132 | 4 | 4.437 | -0.4368 |
| 133 | 7 | 6.803 | 0.1966 |
| 134 | 5 | 5.459 | -0.4588 |
| 135 | 8 | 8.044 | -0.04417 |
| 136 | 6 | 6.677 | -0.6768 |
| 137 | 9 | 6.854 | 2.146 |
| 138 | 6 | 6.446 | -0.4459 |
| 139 | 4 | 4.638 | -0.6383 |
| 140 | 7 | 7.381 | -0.3807 |
| 141 | 2 | 3.568 | -1.568 |
| 142 | 8 | 9.029 | -1.029 |
| 143 | 9 | 8.334 | 0.6659 |
| 144 | 6 | 6.008 | -0.008018 |
| 145 | 5 | 4.618 | 0.3822 |
| 146 | 7 | 6.652 | 0.3482 |
| 147 | 8 | 7.486 | 0.514 |
| 148 | 4 | 6.091 | -2.091 |
| 149 | 9 | 6.396 | 2.604 |
| 150 | 9 | 9.393 | -0.3929 |
| 151 | 9 | 5.001 | 3.999 |
| 152 | 7 | 5.619 | 1.381 |
| 153 | 5 | 6.86 | -1.86 |
| 154 | 7 | 6.876 | 0.1236 |
| 155 | 9 | 10.36 | -1.362 |
| 156 | 8 | 6.383 | 1.617 |
| 157 | 6 | 5.213 | 0.7874 |
| 158 | 9 | 7.827 | 1.173 |
| 159 | 8 | 7.871 | 0.1288 |
| 160 | 7 | 7.543 | -0.5427 |
| 161 | 7 | 7.609 | -0.609 |
| 162 | 7 | 6.464 | 0.5363 |
| 163 | 8 | 7.321 | 0.6786 |
| 164 | 10 | 8.871 | 1.129 |
| 165 | 6 | 6.72 | -0.7205 |
| 166 | 6 | 6.802 | -0.8022 |
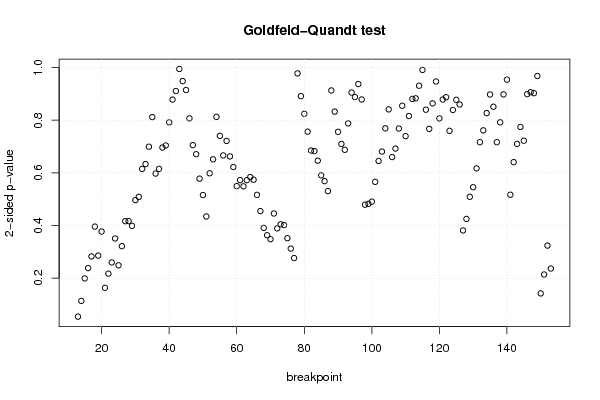
| Goldfeld-Quandt test for Heteroskedasticity | |||
| p-values | Alternative Hypothesis | ||
| breakpoint index | greater | 2-sided | less |
| 13 | 0.9731 | 0.05371 | 0.02685 |
| 14 | 0.9431 | 0.1138 | 0.05689 |
| 15 | 0.9005 | 0.1991 | 0.09954 |
| 16 | 0.881 | 0.238 | 0.119 |
| 17 | 0.8587 | 0.2826 | 0.1413 |
| 18 | 0.8021 | 0.3958 | 0.1979 |
| 19 | 0.8572 | 0.2856 | 0.1428 |
| 20 | 0.8114 | 0.3771 | 0.1886 |
| 21 | 0.9183 | 0.1633 | 0.08167 |
| 22 | 0.8915 | 0.2171 | 0.1085 |
| 23 | 0.8702 | 0.2597 | 0.1298 |
| 24 | 0.8247 | 0.3507 | 0.1753 |
| 25 | 0.8756 | 0.2488 | 0.1244 |
| 26 | 0.8393 | 0.3214 | 0.1607 |
| 27 | 0.7918 | 0.4164 | 0.2082 |
| 28 | 0.7917 | 0.4166 | 0.2083 |
| 29 | 0.8007 | 0.3986 | 0.1993 |
| 30 | 0.7518 | 0.4964 | 0.2482 |
| 31 | 0.7456 | 0.5089 | 0.2544 |
| 32 | 0.6925 | 0.615 | 0.3075 |
| 33 | 0.6834 | 0.6332 | 0.3166 |
| 34 | 0.6504 | 0.6993 | 0.3496 |
| 35 | 0.5941 | 0.8117 | 0.4059 |
| 36 | 0.7013 | 0.5974 | 0.2987 |
| 37 | 0.6925 | 0.6151 | 0.3075 |
| 38 | 0.6519 | 0.6962 | 0.3481 |
| 39 | 0.648 | 0.7041 | 0.352 |
| 40 | 0.6041 | 0.7917 | 0.3959 |
| 41 | 0.5609 | 0.8782 | 0.4391 |
| 42 | 0.5445 | 0.911 | 0.4555 |
| 43 | 0.4974 | 0.9947 | 0.5026 |
| 44 | 0.4743 | 0.9486 | 0.5257 |
| 45 | 0.4574 | 0.9148 | 0.5426 |
| 46 | 0.4036 | 0.8071 | 0.5965 |
| 47 | 0.3527 | 0.7055 | 0.6473 |
| 48 | 0.3354 | 0.6708 | 0.6646 |
| 49 | 0.2889 | 0.5779 | 0.7111 |
| 50 | 0.2579 | 0.5157 | 0.7421 |
| 51 | 0.2172 | 0.4343 | 0.7828 |
| 52 | 0.2992 | 0.5985 | 0.7008 |
| 53 | 0.3257 | 0.6514 | 0.6743 |
| 54 | 0.4064 | 0.8128 | 0.5936 |
| 55 | 0.3702 | 0.7405 | 0.6298 |
| 56 | 0.3331 | 0.6661 | 0.6669 |
| 57 | 0.3607 | 0.7214 | 0.6393 |
| 58 | 0.3313 | 0.6625 | 0.6687 |
| 59 | 0.311 | 0.622 | 0.689 |
| 60 | 0.2748 | 0.5496 | 0.7252 |
| 61 | 0.2862 | 0.5724 | 0.7138 |
| 62 | 0.2744 | 0.5488 | 0.7256 |
| 63 | 0.2862 | 0.5723 | 0.7138 |
| 64 | 0.292 | 0.584 | 0.708 |
| 65 | 0.2869 | 0.5738 | 0.7131 |
| 66 | 0.2583 | 0.5165 | 0.7417 |
| 67 | 0.2273 | 0.4547 | 0.7727 |
| 68 | 0.1955 | 0.3909 | 0.8045 |
| 69 | 0.1815 | 0.363 | 0.8185 |
| 70 | 0.174 | 0.3479 | 0.826 |
| 71 | 0.2228 | 0.4456 | 0.7772 |
| 72 | 0.1946 | 0.3892 | 0.8054 |
| 73 | 0.2024 | 0.4049 | 0.7976 |
| 74 | 0.2009 | 0.4017 | 0.7991 |
| 75 | 0.1759 | 0.3518 | 0.8241 |
| 76 | 0.1561 | 0.3122 | 0.8439 |
| 77 | 0.1381 | 0.2763 | 0.8619 |
| 78 | 0.489 | 0.9779 | 0.511 |
| 79 | 0.4456 | 0.8912 | 0.5544 |
| 80 | 0.4122 | 0.8243 | 0.5878 |
| 81 | 0.3782 | 0.7564 | 0.6218 |
| 82 | 0.3424 | 0.6848 | 0.6576 |
| 83 | 0.3413 | 0.6827 | 0.6587 |
| 84 | 0.3232 | 0.6464 | 0.6768 |
| 85 | 0.2952 | 0.5905 | 0.7048 |
| 86 | 0.2842 | 0.5685 | 0.7158 |
| 87 | 0.2653 | 0.5306 | 0.7347 |
| 88 | 0.4565 | 0.913 | 0.5435 |
| 89 | 0.4163 | 0.8326 | 0.5837 |
| 90 | 0.3779 | 0.7559 | 0.6221 |
| 91 | 0.3549 | 0.7097 | 0.6451 |
| 92 | 0.3438 | 0.6875 | 0.6562 |
| 93 | 0.3939 | 0.7878 | 0.6061 |
| 94 | 0.4526 | 0.9052 | 0.5474 |
| 95 | 0.444 | 0.8879 | 0.556 |
| 96 | 0.4686 | 0.9372 | 0.5314 |
| 97 | 0.4394 | 0.8787 | 0.5606 |
| 98 | 0.7604 | 0.4791 | 0.2396 |
| 99 | 0.7588 | 0.4824 | 0.2412 |
| 100 | 0.7547 | 0.4905 | 0.2453 |
| 101 | 0.7171 | 0.5658 | 0.2829 |
| 102 | 0.6774 | 0.6452 | 0.3226 |
| 103 | 0.6595 | 0.681 | 0.3405 |
| 104 | 0.6154 | 0.7691 | 0.3846 |
| 105 | 0.5794 | 0.8411 | 0.4206 |
| 106 | 0.67 | 0.66 | 0.33 |
| 107 | 0.654 | 0.692 | 0.346 |
| 108 | 0.6158 | 0.7684 | 0.3842 |
| 109 | 0.5726 | 0.8549 | 0.4274 |
| 110 | 0.6302 | 0.7395 | 0.3698 |
| 111 | 0.5921 | 0.8159 | 0.4079 |
| 112 | 0.5595 | 0.881 | 0.4405 |
| 113 | 0.5584 | 0.8831 | 0.4416 |
| 114 | 0.5345 | 0.931 | 0.4655 |
| 115 | 0.4955 | 0.9909 | 0.5045 |
| 116 | 0.58 | 0.8399 | 0.42 |
| 117 | 0.6164 | 0.7672 | 0.3836 |
| 118 | 0.568 | 0.864 | 0.432 |
| 119 | 0.5264 | 0.9471 | 0.4736 |
| 120 | 0.5966 | 0.8068 | 0.4034 |
| 121 | 0.5607 | 0.8785 | 0.4393 |
| 122 | 0.5564 | 0.8873 | 0.4436 |
| 123 | 0.6201 | 0.7597 | 0.3799 |
| 124 | 0.5805 | 0.839 | 0.4195 |
| 125 | 0.5612 | 0.8775 | 0.4388 |
| 126 | 0.5701 | 0.8598 | 0.4299 |
| 127 | 0.8094 | 0.3812 | 0.1906 |
| 128 | 0.7874 | 0.4251 | 0.2126 |
| 129 | 0.7455 | 0.509 | 0.2545 |
| 130 | 0.7273 | 0.5454 | 0.2727 |
| 131 | 0.6915 | 0.617 | 0.3085 |
| 132 | 0.6418 | 0.7165 | 0.3582 |
| 133 | 0.6193 | 0.7614 | 0.3807 |
| 134 | 0.5865 | 0.8269 | 0.4135 |
| 135 | 0.5511 | 0.8978 | 0.4489 |
| 136 | 0.5744 | 0.8511 | 0.4256 |
| 137 | 0.6418 | 0.7165 | 0.3582 |
| 138 | 0.604 | 0.7919 | 0.396 |
| 139 | 0.551 | 0.898 | 0.449 |
| 140 | 0.477 | 0.9541 | 0.523 |
| 141 | 0.7416 | 0.5168 | 0.2584 |
| 142 | 0.6797 | 0.6407 | 0.3203 |
| 143 | 0.6449 | 0.7101 | 0.3551 |
| 144 | 0.6128 | 0.7743 | 0.3872 |
| 145 | 0.639 | 0.722 | 0.361 |
| 146 | 0.5505 | 0.899 | 0.4495 |
| 147 | 0.4532 | 0.9063 | 0.5468 |
| 148 | 0.5486 | 0.9028 | 0.4514 |
| 149 | 0.5161 | 0.9679 | 0.4839 |
| 150 | 0.929 | 0.142 | 0.07102 |
| 151 | 0.893 | 0.214 | 0.107 |
| 152 | 0.8381 | 0.3237 | 0.1619 |
| 153 | 0.8818 | 0.2365 | 0.1182 |
| Meta Analysis of Goldfeld-Quandt test for Heteroskedasticity | |||
| Description | # significant tests | % significant tests | OK/NOK |
| 1% type I error level | 0 | 0 | OK |
| 5% type I error level | 0 | 0 | OK |
| 10% type I error level | 1 | 0.0070922 | OK |
| Ramsey RESET F-Test for powers (2 and 3) of fitted values |
> reset_test_fitted RESET test data: mylm RESET = 5.922, df1 = 2, df2 = 154, p-value = 0.003328 |
| Ramsey RESET F-Test for powers (2 and 3) of regressors |
> reset_test_regressors RESET test data: mylm RESET = 0.64581, df1 = 18, df2 = 138, p-value = 0.8576 |
| Ramsey RESET F-Test for powers (2 and 3) of principal components |
> reset_test_principal_components RESET test data: mylm RESET = 4.4612, df1 = 2, df2 = 154, p-value = 0.01308 |
| Variance Inflation Factors (Multicollinearity) |
> vif
      Relative_Advantage     Perceived_Usefulness    Perceived_Ease_of_Use
                1.596805                 1.854093                 2.549721
     Information_Quality           System_Quality                   groupB
                2.891852                 1.893668                 1.267010
                 genderB  `Intention_to_Use(t-1)` `Intention_to_Use(t-1s)`
                1.140788                 1.091868                 1.082982
|