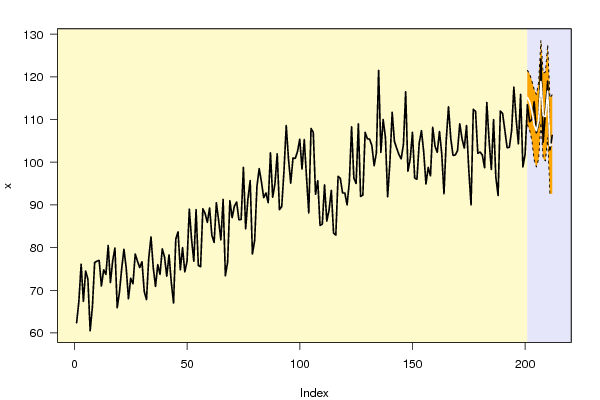
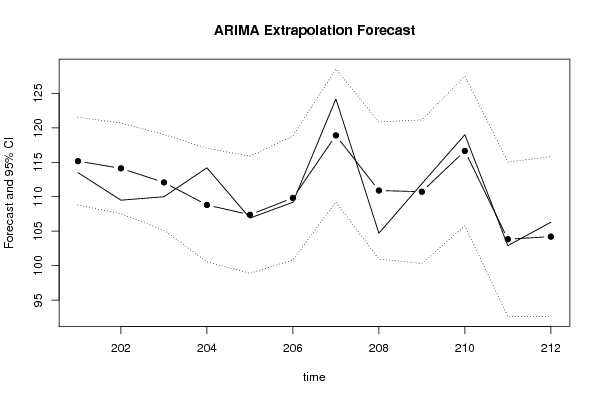
| Univariate ARIMA Extrapolation Forecast | ||||||||
| time | Y[t] | F[t] | 95% LB | 95% UB | p-value (H0: Y[t] = F[t]) | P(F[t]>Y[t-1]) | P(F[t]>Y[t-s]) | P(F[t]>Y[200]) |
| 188 | 92.2 | - | - | - | - | - | - | - |
| 189 | 112 | - | - | - | - | - | - | - |
| 190 | 111.4 | - | - | - | - | - | - | - |
| 191 | 107.5 | - | - | - | - | - | - | - |
| 192 | 103.4 | - | - | - | - | - | - | - |
| 193 | 103.5 | - | - | - | - | - | - | - |
| 194 | 107.4 | - | - | - | - | - | - | - |
| 195 | 117.6 | - | - | - | - | - | - | - |
| 196 | 110.2 | - | - | - | - | - | - | - |
| 197 | 104.3 | - | - | - | - | - | - | - |
| 198 | 115.9 | - | - | - | - | - | - | - |
| 199 | 98.9 | - | - | - | - | - | - | - |
| 200 | 101.9 | - | - | - | - | - | - | - |
| 201 | 113.5 | 115.1697 | 108.7962 | 121.5431 | 0.3038 | 1 | 0.8352 | 1 |
| 202 | 109.5 | 114.117 | 107.5244 | 120.7096 | 0.0849 | 0.5728 | 0.7904 | 0.9999 |
| 203 | 110 | 112.0822 | 105.1313 | 119.0331 | 0.2786 | 0.7667 | 0.9018 | 0.998 |
| 204 | 114.2 | 108.8029 | 100.5589 | 117.0469 | 0.0997 | 0.388 | 0.9005 | 0.9496 |
| 205 | 106.9 | 107.3818 | 98.887 | 115.8766 | 0.4557 | 0.0578 | 0.8148 | 0.897 |
| 206 | 109.2 | 109.8199 | 100.8272 | 118.8126 | 0.4463 | 0.7377 | 0.7011 | 0.9578 |
| 207 | 124.2 | 118.9041 | 109.2587 | 128.5494 | 0.1409 | 0.9757 | 0.6045 | 0.9997 |
| 208 | 104.7 | 110.899 | 100.9443 | 120.8538 | 0.1111 | 0.0044 | 0.5547 | 0.9618 |
| 209 | 111.9 | 110.7299 | 100.3061 | 121.1536 | 0.4129 | 0.8716 | 0.8867 | 0.9516 |
| 210 | 119 | 116.6465 | 105.7733 | 127.5196 | 0.3357 | 0.8039 | 0.5535 | 0.9961 |
| 211 | 102.9 | 103.8358 | 92.6279 | 115.0436 | 0.435 | 0.004 | 0.806 | 0.6325 |
| 212 | 106.3 | 104.2102 | 92.5932 | 115.8272 | 0.3622 | 0.5875 | 0.6516 | 0.6516 |
| Univariate ARIMA Extrapolation Forecast Performance | |||||||||
| time | % S.E. | PE | MAPE | sMAPE | Sq.E | MSE | RMSE | ScaledE | MASE |
| 201 | 0.0282 | -0.0147 | 0.0147 | 0.0146 | 2.7878 | 0 | 0 | -0.2121 | 0.2121 |
| 202 | 0.0295 | -0.0422 | 0.0284 | 0.0279 | 21.317 | 12.0524 | 3.4717 | -0.5865 | 0.3993 |
| 203 | 0.0316 | -0.0189 | 0.0253 | 0.0249 | 4.3356 | 9.4801 | 3.079 | -0.2645 | 0.3543 |
| 204 | 0.0387 | 0.0473 | 0.0308 | 0.0308 | 29.1286 | 14.3922 | 3.7937 | 0.6855 | 0.4371 |
| 205 | 0.0404 | -0.0045 | 0.0255 | 0.0255 | 0.2321 | 11.5602 | 3.4 | -0.0612 | 0.362 |
| 206 | 0.0418 | -0.0057 | 0.0222 | 0.0222 | 0.3843 | 9.6975 | 3.1141 | -0.0787 | 0.3148 |
| 207 | 0.0414 | 0.0426 | 0.0251 | 0.0253 | 28.047 | 12.3189 | 3.5098 | 0.6727 | 0.3659 |
| 208 | 0.0458 | -0.0592 | 0.0294 | 0.0293 | 38.4279 | 15.5825 | 3.9475 | -0.7874 | 0.4186 |
| 209 | 0.048 | 0.0105 | 0.0273 | 0.0272 | 1.3692 | 14.0033 | 3.7421 | 0.1486 | 0.3886 |
| 210 | 0.0476 | 0.0198 | 0.0265 | 0.0265 | 5.5391 | 13.1569 | 3.6272 | 0.2989 | 0.3796 |
| 211 | 0.0551 | -0.0091 | 0.0249 | 0.0249 | 0.8757 | 12.0404 | 3.4699 | -0.1189 | 0.3559 |
| 212 | 0.0569 | 0.0197 | 0.0245 | 0.0245 | 4.3672 | 11.4009 | 3.3765 | 0.2654 | 0.3484 |