| Multiple Linear Regression - Estimated Regression Equation |
| Intention_to_Use[t] = -3.25538 + 0.338869Relative_Advantage[t] + 0.0619599Perceived_Usefulness[t] + 0.0966016Perceived_Ease_of_Use[t] + 0.0321793Information_Quality[t] + 0.0967844System_Quality[t] + 0.767678groupB[t] + 0.414423genderB[t] + 0.0226345`Intention_to_Use(t-1)`[t] + 0.0104794`Intention_to_Use(t-1s)`[t] -0.0123603`Intention_to_Use(t-2s)`[t] -0.0600236`Intention_to_Use(t-3s)`[t] + 0.11702`Intention_to_Use(t-4s)`[t] -0.0234479`Intention_to_Use(t-5s)`[t] -0.0717622`Intention_to_Use(t-6s)`[t] + 0.0995035`Intention_to_Use(t-7s)`[t] -0.040039`Intention_to_Use(t-8s)`[t] -0.0716597`Intention_to_Use(t-9s)`[t] + 0.135671`Intention_to_Use(t-10s)`[t] + 0.105795`Intention_to_Use(t-11s)`[t] + 0.0177579`Intention_to_Use(t-12s)`[t] + e[t] |
| Warning: you did not specify the column number of the endogenous series! The first column was selected by default. |
| Multiple Linear Regression - Ordinary Least Squares | |||||
| Variable | Parameter | S.D. | T-STAT H0: parameter = 0 | 2-tail p-value | 1-tail p-value |
| (Intercept) | -3.255 | 1.784 | -1.8250e+00 | 0.07046 | 0.03523 |
| Relative_Advantage | +0.3389 | 0.07218 | +4.6950e+00 | 7.104e-06 | 3.552e-06 |
| Perceived_Usefulness | +0.06196 | 0.06856 | +9.0380e-01 | 0.3679 | 0.184 |
| Perceived_Ease_of_Use | +0.0966 | 0.06265 | +1.5420e+00 | 0.1257 | 0.06286 |
| Information_Quality | +0.03218 | 0.07237 | +4.4460e-01 | 0.6574 | 0.3287 |
| System_Quality | +0.09678 | 0.03389 | +2.8560e+00 | 0.005057 | 0.002528 |
| groupB | +0.7677 | 0.2745 | +2.7960e+00 | 0.006011 | 0.003006 |
| genderB | +0.4144 | 0.2342 | +1.7700e+00 | 0.07928 | 0.03964 |
| `Intention_to_Use(t-1)` | +0.02263 | 0.06029 | +3.7540e-01 | 0.708 | 0.354 |
| `Intention_to_Use(t-1s)` | +0.01048 | 0.05747 | +1.8230e-01 | 0.8556 | 0.4278 |
| `Intention_to_Use(t-2s)` | -0.01236 | 0.05932 | -2.0840e-01 | 0.8353 | 0.4176 |
| `Intention_to_Use(t-3s)` | -0.06002 | 0.05714 | -1.0500e+00 | 0.2956 | 0.1478 |
| `Intention_to_Use(t-4s)` | +0.117 | 0.05905 | +1.9820e+00 | 0.04979 | 0.02489 |
| `Intention_to_Use(t-5s)` | -0.02345 | 0.06093 | -3.8480e-01 | 0.701 | 0.3505 |
| `Intention_to_Use(t-6s)` | -0.07176 | 0.0588 | -1.2200e+00 | 0.2247 | 0.1123 |
| `Intention_to_Use(t-7s)` | +0.0995 | 0.05709 | +1.7430e+00 | 0.08392 | 0.04196 |
| `Intention_to_Use(t-8s)` | -0.04004 | 0.05925 | -6.7580e-01 | 0.5005 | 0.2502 |
| `Intention_to_Use(t-9s)` | -0.07166 | 0.05597 | -1.2800e+00 | 0.2029 | 0.1014 |
| `Intention_to_Use(t-10s)` | +0.1357 | 0.05827 | +2.3280e+00 | 0.02156 | 0.01078 |
| `Intention_to_Use(t-11s)` | +0.1058 | 0.05621 | +1.8820e+00 | 0.06222 | 0.03111 |
| `Intention_to_Use(t-12s)` | +0.01776 | 0.05636 | +3.1510e-01 | 0.7533 | 0.3766 |
| Multiple Linear Regression - Regression Statistics | |
| Multiple R | 0.8095 |
| R-squared | 0.6552 |
| Adjusted R-squared | 0.5983 |
| F-TEST (value) | 11.5 |
| F-TEST (DF numerator) | 20 |
| F-TEST (DF denominator) | 121 |
| p-value | 0 |
| Multiple Linear Regression - Residual Statistics | |
| Residual Standard Deviation | 1.276 |
| Sum Squared Residuals | 196.9 |
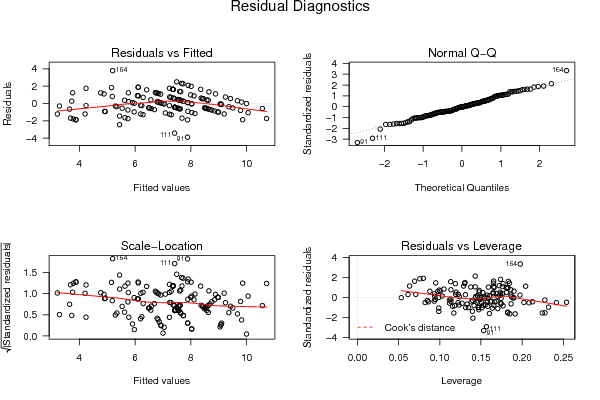
| Menu of Residual Diagnostics | |
| Description | Link |
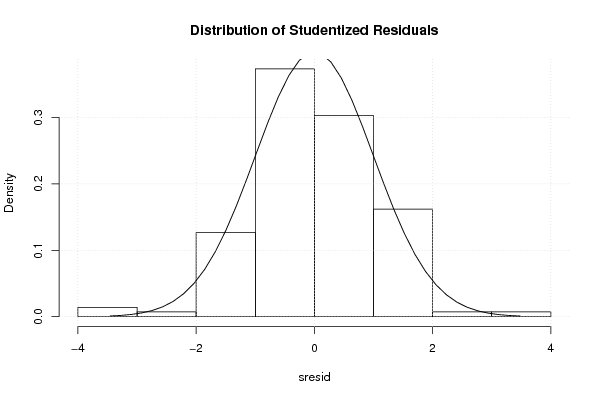
| Histogram | Compute |
| Central Tendency | Compute |
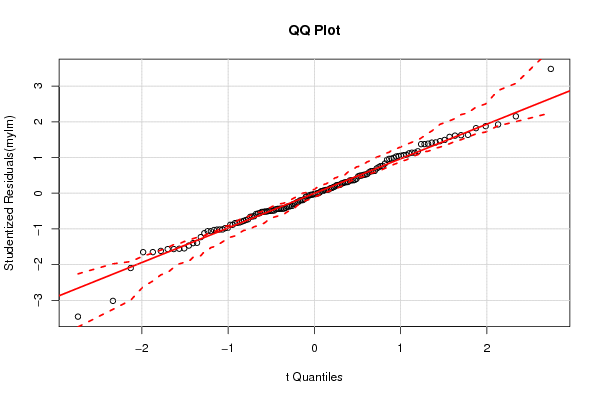
| QQ Plot | Compute |
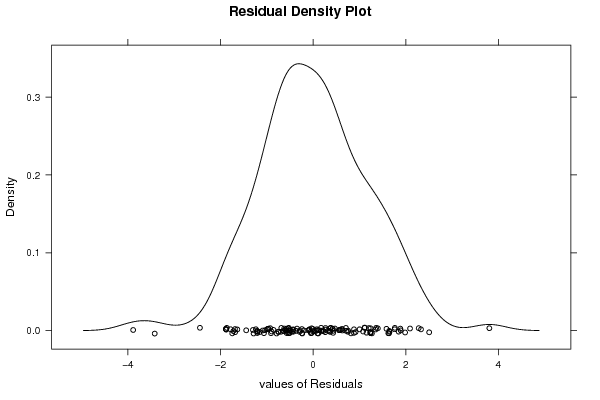
| Kernel Density Plot | Compute |
| Skewness/Kurtosis Test | Compute |
| Skewness-Kurtosis Plot | Compute |
| Harrell-Davis Plot | Compute |
| Bootstrap Plot -- Central Tendency | Compute |
| Blocked Bootstrap Plot -- Central Tendency | Compute |
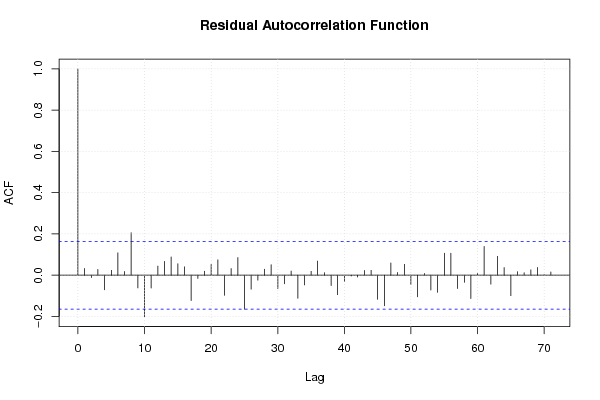
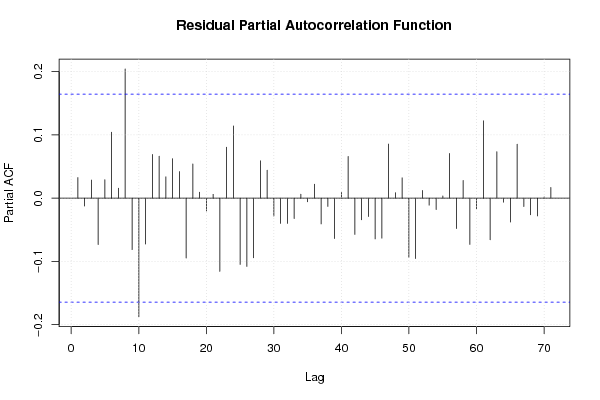
| (Partial) Autocorrelation Plot | Compute |
| Spectral Analysis | Compute |
| Tukey lambda PPCC Plot | Compute |
| Box-Cox Normality Plot | Compute |
| Summary Statistics | Compute |
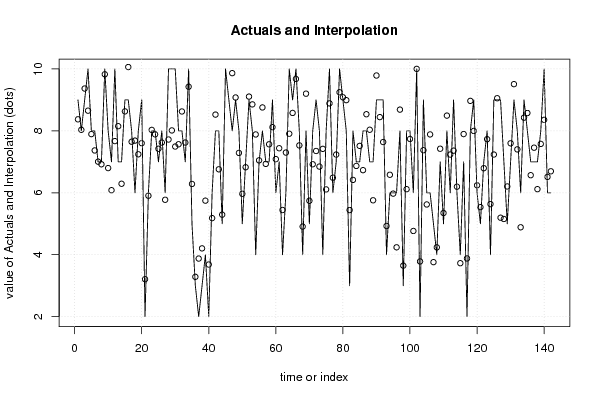
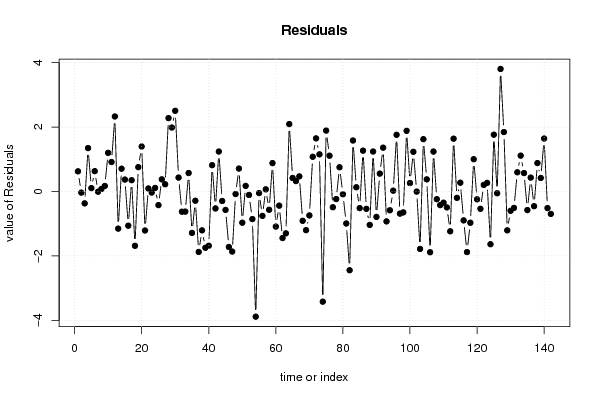
| Multiple Linear Regression - Actuals, Interpolation, and Residuals | |||
| Time or Index | Actuals | Interpolation Forecast | Residuals Prediction Error |
| 1 | 9 | 8.374 | 0.6264 |
| 2 | 8 | 8.034 | -0.03421 |
| 3 | 9 | 9.368 | -0.368 |
| 4 | 10 | 8.652 | 1.348 |
| 5 | 8 | 7.895 | 0.1053 |
| 6 | 8 | 7.368 | 0.6319 |
| 7 | 7 | 7.005 | -0.005456 |
| 8 | 7 | 6.921 | 0.0787 |
| 9 | 10 | 9.828 | 0.1723 |
| 10 | 8 | 6.799 | 1.201 |
| 11 | 7 | 6.084 | 0.9162 |
| 12 | 10 | 7.67 | 2.33 |
| 13 | 7 | 8.152 | -1.152 |
| 14 | 7 | 6.292 | 0.7081 |
| 15 | 9 | 8.63 | 0.3705 |
| 16 | 9 | 10.06 | -1.061 |
| 17 | 8 | 7.649 | 0.3513 |
| 18 | 6 | 7.686 | -1.686 |
| 19 | 8 | 7.244 | 0.7563 |
| 20 | 9 | 7.603 | 1.397 |
| 21 | 2 | 3.21 | -1.21 |
| 22 | 6 | 5.906 | 0.09438 |
| 23 | 8 | 8.032 | -0.0318 |
| 24 | 8 | 7.889 | 0.1115 |
| 25 | 7 | 7.423 | -0.4226 |
| 26 | 8 | 7.623 | 0.3771 |
| 27 | 6 | 5.775 | 0.2254 |
| 28 | 10 | 7.721 | 2.279 |
| 29 | 10 | 8.014 | 1.986 |
| 30 | 10 | 7.494 | 2.506 |
| 31 | 8 | 7.568 | 0.4324 |
| 32 | 8 | 8.626 | -0.6262 |
| 33 | 7 | 7.624 | -0.6239 |
| 34 | 10 | 9.426 | 0.5745 |
| 35 | 5 | 6.285 | -1.285 |
| 36 | 3 | 3.286 | -0.2862 |
| 37 | 2 | 3.876 | -1.876 |
| 38 | 3 | 4.206 | -1.206 |
| 39 | 4 | 5.746 | -1.746 |
| 40 | 2 | 3.684 | -1.684 |
| 41 | 6 | 5.182 | 0.8179 |
| 42 | 8 | 8.525 | -0.5255 |
| 43 | 8 | 6.759 | 1.241 |
| 44 | 5 | 5.294 | -0.2939 |
| 45 | 10 | 10.57 | -0.5714 |
| 46 | 9 | 10.72 | -1.722 |
| 47 | 8 | 9.864 | -1.864 |
| 48 | 9 | 9.078 | -0.07778 |
| 49 | 8 | 7.288 | 0.7123 |
| 50 | 5 | 5.969 | -0.9685 |
| 51 | 7 | 6.825 | 0.1745 |
| 52 | 9 | 9.107 | -0.1072 |
| 53 | 8 | 8.856 | -0.8559 |
| 54 | 4 | 7.885 | -3.885 |
| 55 | 7 | 7.048 | -0.0479 |
| 56 | 8 | 8.757 | -0.7566 |
| 57 | 7 | 6.933 | 0.067 |
| 58 | 7 | 7.567 | -0.5669 |
| 59 | 9 | 8.118 | 0.8816 |
| 60 | 6 | 7.088 | -1.088 |
| 61 | 7 | 7.439 | -0.439 |
| 62 | 4 | 5.444 | -1.444 |
| 63 | 6 | 7.299 | -1.299 |
| 64 | 10 | 7.908 | 2.092 |
| 65 | 9 | 8.579 | 0.4208 |
| 66 | 10 | 9.677 | 0.3234 |
| 67 | 8 | 7.531 | 0.4688 |
| 68 | 4 | 4.909 | -0.9091 |
| 69 | 8 | 9.201 | -1.201 |
| 70 | 5 | 5.743 | -0.7428 |
| 71 | 8 | 6.921 | 1.079 |
| 72 | 9 | 7.35 | 1.65 |
| 73 | 8 | 6.846 | 1.154 |
| 74 | 4 | 7.42 | -3.42 |
| 75 | 8 | 6.109 | 1.891 |
| 76 | 10 | 8.889 | 1.111 |
| 77 | 6 | 6.488 | -0.4881 |
| 78 | 7 | 7.235 | -0.2346 |
| 79 | 10 | 9.247 | 0.7528 |
| 80 | 9 | 9.086 | -0.08563 |
| 81 | 8 | 8.993 | -0.9927 |
| 82 | 3 | 5.443 | -2.443 |
| 83 | 8 | 6.416 | 1.584 |
| 84 | 7 | 6.868 | 0.1321 |
| 85 | 7 | 7.515 | -0.5149 |
| 86 | 8 | 6.731 | 1.269 |
| 87 | 8 | 8.537 | -0.5373 |
| 88 | 7 | 8.037 | -1.037 |
| 89 | 7 | 5.758 | 1.242 |
| 90 | 9 | 9.788 | -0.7881 |
| 91 | 9 | 8.445 | 0.5553 |
| 92 | 9 | 7.639 | 1.361 |
| 93 | 4 | 4.928 | -0.9282 |
| 94 | 6 | 6.582 | -0.5823 |
| 95 | 6 | 5.973 | 0.02665 |
| 96 | 6 | 4.239 | 1.761 |
| 97 | 8 | 8.687 | -0.6865 |
| 98 | 3 | 3.648 | -0.6483 |
| 99 | 8 | 6.117 | 1.883 |
| 100 | 8 | 7.738 | 0.2622 |
| 101 | 6 | 4.767 | 1.233 |
| 102 | 10 | 10 | -0.002448 |
| 103 | 2 | 3.783 | -1.783 |
| 104 | 9 | 7.375 | 1.625 |
| 105 | 6 | 5.623 | 0.377 |
| 106 | 6 | 7.886 | -1.886 |
| 107 | 5 | 3.76 | 1.24 |
| 108 | 4 | 4.239 | -0.2385 |
| 109 | 7 | 7.423 | -0.4231 |
| 110 | 5 | 5.347 | -0.3471 |
| 111 | 8 | 8.493 | -0.4931 |
| 112 | 6 | 7.236 | -1.236 |
| 113 | 9 | 7.36 | 1.64 |
| 114 | 6 | 6.197 | -0.1972 |
| 115 | 4 | 3.727 | 0.2733 |
| 116 | 7 | 7.897 | -0.8969 |
| 117 | 2 | 3.88 | -1.88 |
| 118 | 8 | 8.969 | -0.9694 |
| 119 | 9 | 7.997 | 1.003 |
| 120 | 6 | 6.242 | -0.2418 |
| 121 | 5 | 5.536 | -0.5365 |
| 122 | 7 | 6.795 | 0.2052 |
| 123 | 8 | 7.733 | 0.2675 |
| 124 | 4 | 5.636 | -1.637 |
| 125 | 9 | 7.236 | 1.764 |
| 126 | 9 | 9.054 | -0.05396 |
| 127 | 9 | 5.195 | 3.805 |
| 128 | 7 | 5.154 | 1.846 |
| 129 | 5 | 6.205 | -1.205 |
| 130 | 7 | 7.598 | -0.5984 |
| 131 | 9 | 9.509 | -0.5093 |
| 132 | 8 | 7.403 | 0.5968 |
| 133 | 6 | 4.886 | 1.114 |
| 134 | 9 | 8.427 | 0.5728 |
| 135 | 8 | 8.577 | -0.5765 |
| 136 | 7 | 6.568 | 0.4318 |
| 137 | 7 | 7.457 | -0.4567 |
| 138 | 7 | 6.117 | 0.8827 |
| 139 | 8 | 7.579 | 0.4211 |
| 140 | 10 | 8.356 | 1.644 |
| 141 | 6 | 6.514 | -0.5143 |
| 142 | 6 | 6.695 | -0.6955 |
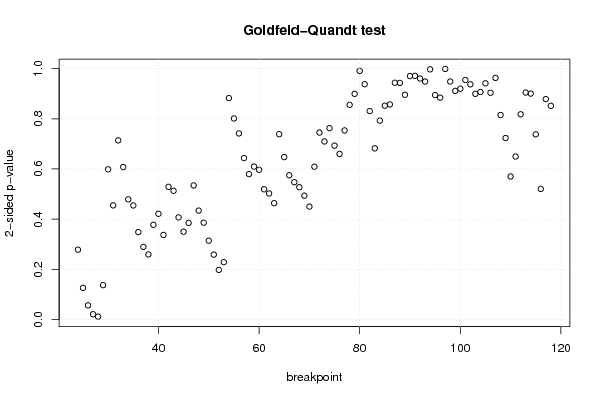
| Goldfeld-Quandt test for Heteroskedasticity | |||
| p-values | Alternative Hypothesis | ||
| breakpoint index | greater | 2-sided | less |
| 24 | 0.1392 | 0.2783 | 0.8608 |
| 25 | 0.06309 | 0.1262 | 0.9369 |
| 26 | 0.02835 | 0.05669 | 0.9717 |
| 27 | 0.01065 | 0.02131 | 0.9893 |
| 28 | 0.00584 | 0.01168 | 0.9942 |
| 29 | 0.06853 | 0.1371 | 0.9315 |
| 30 | 0.2994 | 0.5988 | 0.7006 |
| 31 | 0.2276 | 0.4551 | 0.7724 |
| 32 | 0.357 | 0.714 | 0.643 |
| 33 | 0.3037 | 0.6073 | 0.6963 |
| 34 | 0.2396 | 0.4791 | 0.7604 |
| 35 | 0.2274 | 0.4548 | 0.7726 |
| 36 | 0.1744 | 0.3487 | 0.8256 |
| 37 | 0.1448 | 0.2896 | 0.8552 |
| 38 | 0.1299 | 0.2597 | 0.8701 |
| 39 | 0.1889 | 0.3778 | 0.8111 |
| 40 | 0.2107 | 0.4214 | 0.7893 |
| 41 | 0.1686 | 0.3372 | 0.8314 |
| 42 | 0.2645 | 0.529 | 0.7355 |
| 43 | 0.2565 | 0.513 | 0.7435 |
| 44 | 0.2036 | 0.4072 | 0.7964 |
| 45 | 0.175 | 0.3501 | 0.825 |
| 46 | 0.1926 | 0.3852 | 0.8074 |
| 47 | 0.2672 | 0.5344 | 0.7328 |
| 48 | 0.2171 | 0.4341 | 0.7829 |
| 49 | 0.193 | 0.386 | 0.807 |
| 50 | 0.1571 | 0.3143 | 0.8429 |
| 51 | 0.1294 | 0.2589 | 0.8706 |
| 52 | 0.09902 | 0.198 | 0.901 |
| 53 | 0.1144 | 0.2288 | 0.8856 |
| 54 | 0.4413 | 0.8826 | 0.5587 |
| 55 | 0.4006 | 0.8013 | 0.5994 |
| 56 | 0.3708 | 0.7416 | 0.6292 |
| 57 | 0.3217 | 0.6434 | 0.6783 |
| 58 | 0.2898 | 0.5797 | 0.7102 |
| 59 | 0.3048 | 0.6096 | 0.6952 |
| 60 | 0.2984 | 0.5968 | 0.7016 |
| 61 | 0.2596 | 0.5192 | 0.7404 |
| 62 | 0.2512 | 0.5023 | 0.7488 |
| 63 | 0.2319 | 0.4638 | 0.7681 |
| 64 | 0.3693 | 0.7386 | 0.6307 |
| 65 | 0.3236 | 0.6473 | 0.6764 |
| 66 | 0.2875 | 0.575 | 0.7125 |
| 67 | 0.2737 | 0.5473 | 0.7263 |
| 68 | 0.2637 | 0.5273 | 0.7363 |
| 69 | 0.2469 | 0.4937 | 0.7531 |
| 70 | 0.2251 | 0.4501 | 0.7749 |
| 71 | 0.3045 | 0.609 | 0.6955 |
| 72 | 0.3726 | 0.7452 | 0.6274 |
| 73 | 0.3549 | 0.7097 | 0.6451 |
| 74 | 0.6188 | 0.7625 | 0.3812 |
| 75 | 0.6536 | 0.6928 | 0.3464 |
| 76 | 0.6701 | 0.6599 | 0.3299 |
| 77 | 0.6232 | 0.7536 | 0.3768 |
| 78 | 0.5722 | 0.8557 | 0.4278 |
| 79 | 0.5503 | 0.8994 | 0.4497 |
| 80 | 0.4954 | 0.9908 | 0.5046 |
| 81 | 0.4688 | 0.9377 | 0.5312 |
| 82 | 0.5847 | 0.8307 | 0.4153 |
| 83 | 0.6589 | 0.6821 | 0.3411 |
| 84 | 0.6037 | 0.7926 | 0.3963 |
| 85 | 0.5739 | 0.8522 | 0.4261 |
| 86 | 0.5714 | 0.8571 | 0.4286 |
| 87 | 0.5282 | 0.9435 | 0.4718 |
| 88 | 0.5286 | 0.9429 | 0.4714 |
| 89 | 0.5522 | 0.8956 | 0.4478 |
| 90 | 0.5149 | 0.9702 | 0.4851 |
| 91 | 0.5144 | 0.9711 | 0.4856 |
| 92 | 0.5198 | 0.9604 | 0.4802 |
| 93 | 0.5259 | 0.9482 | 0.4741 |
| 94 | 0.4985 | 0.997 | 0.5015 |
| 95 | 0.4472 | 0.8945 | 0.5528 |
| 96 | 0.558 | 0.884 | 0.442 |
| 97 | 0.5007 | 0.9985 | 0.4993 |
| 98 | 0.4742 | 0.9484 | 0.5258 |
| 99 | 0.5444 | 0.9111 | 0.4556 |
| 100 | 0.5401 | 0.9197 | 0.4599 |
| 101 | 0.5227 | 0.9545 | 0.4773 |
| 102 | 0.5314 | 0.9373 | 0.4686 |
| 103 | 0.5503 | 0.8993 | 0.4497 |
| 104 | 0.5466 | 0.9068 | 0.4534 |
| 105 | 0.4707 | 0.9414 | 0.5293 |
| 106 | 0.4518 | 0.9036 | 0.5482 |
| 107 | 0.4815 | 0.9629 | 0.5185 |
| 108 | 0.4075 | 0.8151 | 0.5925 |
| 109 | 0.3616 | 0.7233 | 0.6384 |
| 110 | 0.2851 | 0.5701 | 0.7149 |
| 111 | 0.3249 | 0.6497 | 0.6751 |
| 112 | 0.5911 | 0.8179 | 0.4089 |
| 113 | 0.5478 | 0.9044 | 0.4522 |
| 114 | 0.4502 | 0.9004 | 0.5498 |
| 115 | 0.369 | 0.738 | 0.631 |
| 116 | 0.2603 | 0.5206 | 0.7397 |
| 117 | 0.5607 | 0.8786 | 0.4393 |
| 118 | 0.5742 | 0.8517 | 0.4258 |
| Meta Analysis of Goldfeld-Quandt test for Heteroskedasticity | |||
| Description | # significant tests | % significant tests | OK/NOK |
| 1% type I error level | 0 | 0 | OK |
| 5% type I error level | 2 | 0.0210526 | OK |
| 10% type I error level | 3 | 0.0315789 | OK |
| Ramsey RESET F-Test for powers (2 and 3) of fitted values |
> reset_test_fitted RESET test data: mylm RESET = 4.9286, df1 = 2, df2 = 119, p-value = 0.008782 |
| Ramsey RESET F-Test for powers (2 and 3) of regressors |
> reset_test_regressors RESET test data: mylm RESET = 1.3764, df1 = 40, df2 = 81, p-value = 0.1124 |
| Ramsey RESET F-Test for powers (2 and 3) of principal components |
> reset_test_principal_components RESET test data: mylm RESET = 3.7963, df1 = 2, df2 = 119, p-value = 0.02522 |
| Variance Inflation Factors (Multicollinearity) |
> vif
       Relative_Advantage      Perceived_Usefulness     Perceived_Ease_of_Use
                 1.979496                  2.165159                  2.848839
      Information_Quality            System_Quality                    groupB
                 3.434033                  2.244210                  1.471312
                  genderB   `Intention_to_Use(t-1)`  `Intention_to_Use(t-1s)`
                 1.195866                  1.275727                  1.144090
 `Intention_to_Use(t-2s)`  `Intention_to_Use(t-3s)`  `Intention_to_Use(t-4s)`
                 1.227888                  1.142956                  1.220771
 `Intention_to_Use(t-5s)`  `Intention_to_Use(t-6s)`  `Intention_to_Use(t-7s)`
                 1.292592                  1.210271                  1.144228
 `Intention_to_Use(t-8s)`  `Intention_to_Use(t-9s)` `Intention_to_Use(t-10s)`
                 1.256642                  1.104644                  1.173238
`Intention_to_Use(t-11s)` `Intention_to_Use(t-12s)`
                 1.102741                  1.083307
|