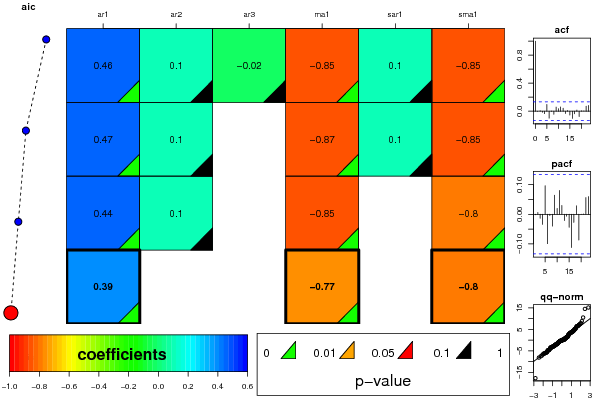
| ARIMA Parameter Estimation and Backward Selection | ||||||
| Iteration | ar1 | ar2 | ar3 | ma1 | sar1 | sma1 |
| Estimates ( 1 ) | 0.459 | 0.1034 | -0.0156 | -0.8524 | 0.1004 | -0.8469 |
| (p-val) | (0.0018 ) | (0.2731 ) | (0.8632 ) | (0 ) | (0.2756 ) | (0 ) |
| Estimates ( 2 ) | 0.4703 | 0.1045 | 0 | -0.8653 | 0.1024 | -0.8459 |
| (p-val) | (2e-04 ) | (0.2617 ) | (NA ) | (0 ) | (0.2658 ) | (0 ) |
| Estimates ( 3 ) | 0.4435 | 0.1026 | 0 | -0.8453 | 0 | -0.7998 |
| (p-val) | (3e-04 ) | (0.2606 ) | (NA ) | (0 ) | (NA ) | (0 ) |
| Estimates ( 4 ) | 0.3945 | 0 | 0 | -0.7699 | 0 | -0.8032 |
| (p-val) | (0.0056 ) | (NA ) | (NA ) | (0 ) | (NA ) | (0 ) |
| Estimates ( 5 ) | NA | NA | NA | NA | NA | NA |
| (p-val) | (NA ) | (NA ) | (NA ) | (NA ) | (NA ) | (NA ) |
| Estimates ( 6 ) | NA | NA | NA | NA | NA | NA |
| (p-val) | (NA ) | (NA ) | (NA ) | (NA ) | (NA ) | (NA ) |
| Estimates ( 7 ) | NA | NA | NA | NA | NA | NA |
| (p-val) | (NA ) | (NA ) | (NA ) | (NA ) | (NA ) | (NA ) |
| Estimates ( 8 ) | NA | NA | NA | NA | NA | NA |
| (p-val) | (NA ) | (NA ) | (NA ) | (NA ) | (NA ) | (NA ) |
| Estimates ( 9 ) | NA | NA | NA | NA | NA | NA |
| (p-val) | (NA ) | (NA ) | (NA ) | (NA ) | (NA ) | (NA ) |
| Estimates ( 10 ) | NA | NA | NA | NA | NA | NA |
| (p-val) | (NA ) | (NA ) | (NA ) | (NA ) | (NA ) | (NA ) |
| Estimates ( 11 ) | NA | NA | NA | NA | NA | NA |
| (p-val) | (NA ) | (NA ) | (NA ) | (NA ) | (NA ) | (NA ) |
| Menu of Residual Diagnostics | |
| Description | Link |
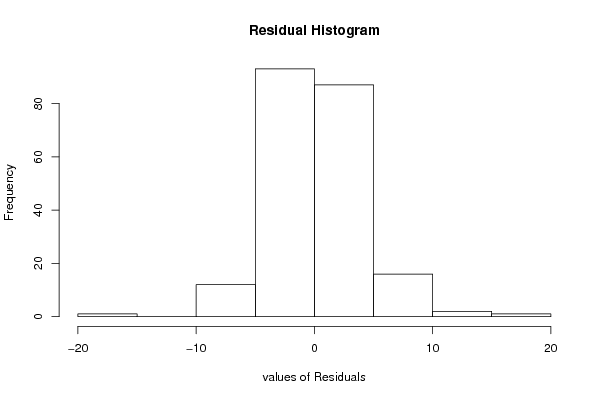
| Histogram | Compute |
| Central Tendency | Compute |
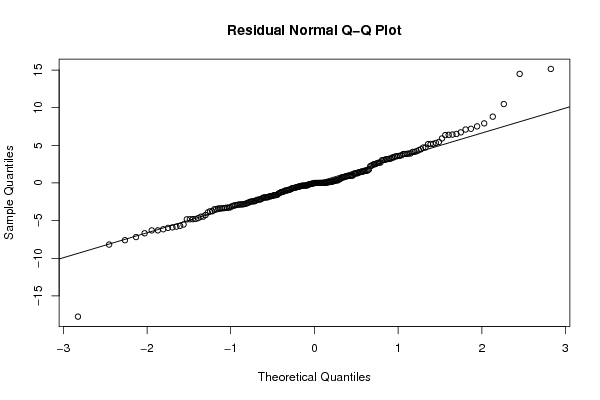
| QQ Plot | Compute |
| Kernel Density Plot | Compute |
| Skewness/Kurtosis Test | Compute |
| Skewness-Kurtosis Plot | Compute |
| Harrell-Davis Plot | Compute |
| Bootstrap Plot -- Central Tendency | Compute |
| Blocked Bootstrap Plot -- Central Tendency | Compute |
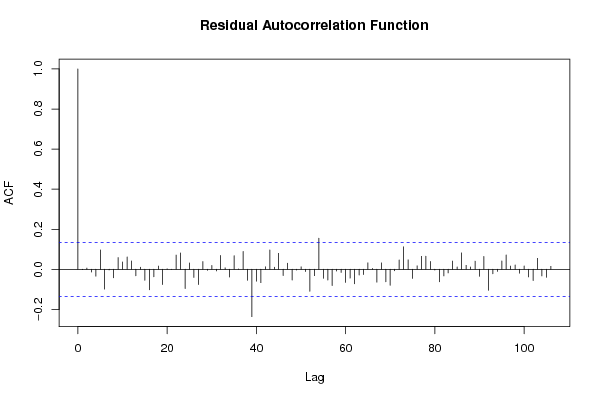
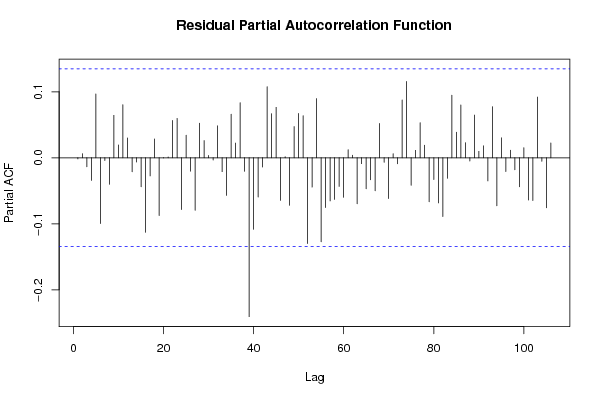
| (Partial) Autocorrelation Plot | Compute |
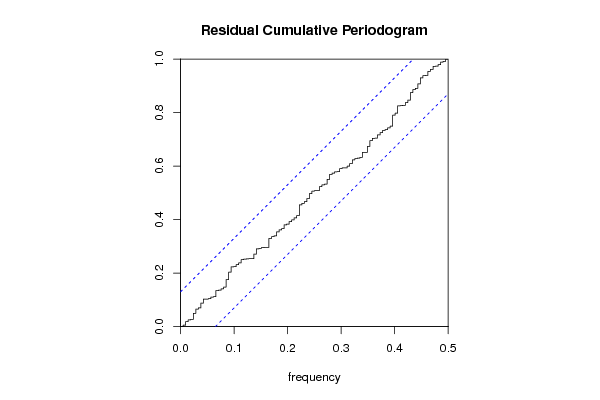
| Spectral Analysis | Compute |
| Tukey lambda PPCC Plot | Compute |
| Box-Cox Normality Plot | Compute |
| Summary Statistics | Compute |