| Tabulation of Results | ||
| groupC x genderC | ||
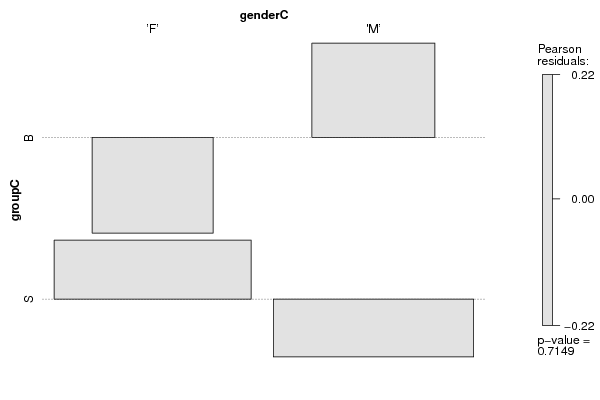
| 'F' | 'M' | B | 23 | 26 | S | 65 | 65 |
| Tabulation of Expected Results | ||
| groupC x genderC | ||
| 'F' | 'M' | B | 24.09 | 24.91 | S | 63.91 | 66.09 |
| Statistical Results | |
| Pearson's Chi-squared test with simulated p-value (based on 2000 replicates) | |
| Exact Pearson Chi Square Statistic | 0.13 |
| P value | 0.74 |