| Correlations for all pairs of data series with p-values |
| pair | Pearson r | Spearman rho | Kendall tau |
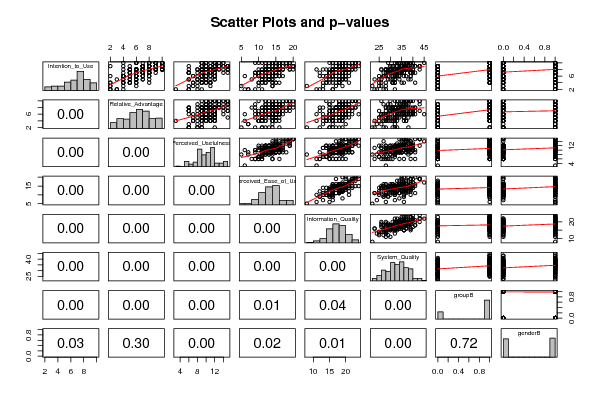
| Intention_to_Use;Relative_Advantage | 0.6397 | 0.5977 | 0.4895 |
| p-value | (0) | (0) | (0) |
| Intention_to_Use;Perceived_Usefulness | 0.4951 | 0.4694 | 0.3725 |
| p-value | (0) | (0) | (0) |
| Intention_to_Use;Perceived_Ease_of_Use | 0.5231 | 0.501 | 0.3939 |
| p-value | (0) | (0) | (0) |
| Intention_to_Use;Information_Quality | 0.5001 | 0.4711 | 0.3702 |
| p-value | (0) | (0) | (0) |
| Intention_to_Use;System_Quality | 0.5329 | 0.5101 | 0.3968 |
| p-value | (0) | (0) | (0) |
| Intention_to_Use;groupB | 0.4524 | 0.4031 | 0.3538 |
| p-value | (0) | (0) | (0) |
| Intention_to_Use;genderB | 0.1631 | 0.2026 | 0.1778 |
| p-value | (0.0291) | (0.0065) | (0.0069) |
| Relative_Advantage;Perceived_Usefulness | 0.4265 | 0.3903 | 0.3042 |
| p-value | (0) | (0) | (0) |
| Relative_Advantage;Perceived_Ease_of_Use | 0.4644 | 0.4298 | 0.3347 |
| p-value | (0) | (0) | (0) |
| Relative_Advantage;Information_Quality | 0.4656 | 0.4348 | 0.3382 |
| p-value | (0) | (0) | (0) |
| Relative_Advantage;System_Quality | 0.4298 | 0.3972 | 0.2996 |
| p-value | (0) | (0) | (0) |
| Relative_Advantage;groupB | 0.4102 | 0.385 | 0.3351 |
| p-value | (0) | (0) | (0) |
| Relative_Advantage;genderB | 0.0774 | 0.0772 | 0.0672 |
| p-value | (0.3034) | (0.3045) | (0.3032) |
| Perceived_Usefulness;Perceived_Ease_of_Use | 0.638 | 0.5758 | 0.4631 |
| p-value | (0) | (0) | (0) |
| Perceived_Usefulness;Information_Quality | 0.5773 | 0.5368 | 0.4288 |
| p-value | (0) | (0) | (0) |
| Perceived_Usefulness;System_Quality | 0.4296 | 0.4096 | 0.3142 |
| p-value | (0) | (0) | (0) |
| Perceived_Usefulness;groupB | 0.2193 | 0.1942 | 0.1694 |
| p-value | (0.0032) | (0.0092) | (0.0096) |
| Perceived_Usefulness;genderB | 0.2094 | 0.2029 | 0.1769 |
| p-value | (0.0049) | (0.0065) | (0.0068) |
| Perceived_Ease_of_Use;Information_Quality | 0.702 | 0.6535 | 0.5259 |
| p-value | (0) | (0) | (0) |
| Perceived_Ease_of_Use;System_Quality | 0.4513 | 0.4014 | 0.3002 |
| p-value | (0) | (0) | (0) |
| Perceived_Ease_of_Use;groupB | 0.1983 | 0.1438 | 0.1235 |
| p-value | (0.0078) | (0.0548) | (0.055) |
| Perceived_Ease_of_Use;genderB | 0.1809 | 0.2117 | 0.1819 |
| p-value | (0.0154) | (0.0044) | (0.0047) |
| Information_Quality;System_Quality | 0.6266 | 0.5985 | 0.4628 |
| p-value | (0) | (0) | (0) |
| Information_Quality;groupB | 0.1522 | 0.108 | 0.0929 |
| p-value | (0.0419) | (0.15) | (0.1494) |
| Information_Quality;genderB | 0.2044 | 0.2177 | 0.1872 |
| p-value | (0.006) | (0.0034) | (0.0037) |
| System_Quality;groupB | 0.2612 | 0.2291 | 0.1929 |
| p-value | (4e-04) | (0.002) | (0.0022) |
| System_Quality;genderB | 0.2138 | 0.2278 | 0.1918 |
| p-value | (0.0041) | (0.0022) | (0.0024) |
| groupB;genderB | -0.0273 | -0.0273 | -0.0273 |
| p-value | (0.7168) | (0.7168) | (0.7157) |