| Tabulation of Results | ||||||||||||||||
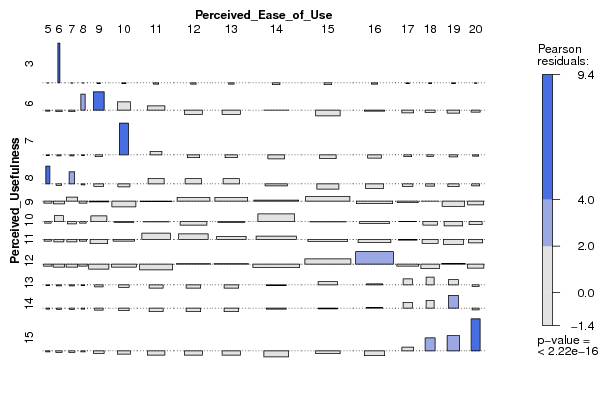
| Perceived_Usefulness x Perceived_Ease_of_Use | ||||||||||||||||
| 5 | 6 | 7 | 8 | 9 | 10 | 11 | 12 | 13 | 14 | 15 | 16 | 17 | 18 | 19 | 20 | 3 | 0 | 1 | 0 | 0 | 0 | 0 | 0 | 0 | 0 | 0 | 0 | 0 | 0 | 0 | 0 | 0 | 6 | 0 | 0 | 0 | 1 | 3 | 2 | 2 | 0 | 0 | 2 | 0 | 1 | 0 | 0 | 0 | 0 | 7 | 0 | 0 | 0 | 0 | 0 | 4 | 1 | 0 | 0 | 0 | 0 | 0 | 0 | 0 | 0 | 0 | 8 | 1 | 0 | 1 | 0 | 0 | 0 | 2 | 2 | 2 | 1 | 0 | 0 | 0 | 0 | 0 | 0 | 9 | 0 | 0 | 1 | 0 | 1 | 0 | 3 | 5 | 5 | 7 | 9 | 3 | 1 | 1 | 0 | 0 | 10 | 0 | 1 | 0 | 0 | 2 | 1 | 2 | 1 | 2 | 8 | 4 | 2 | 1 | 0 | 0 | 0 | 11 | 0 | 0 | 0 | 0 | 0 | 1 | 5 | 5 | 4 | 7 | 4 | 2 | 1 | 0 | 0 | 0 | 12 | 0 | 0 | 0 | 0 | 0 | 1 | 1 | 4 | 4 | 5 | 10 | 11 | 1 | 0 | 2 | 0 | 13 | 0 | 0 | 0 | 0 | 0 | 0 | 0 | 0 | 0 | 1 | 2 | 1 | 1 | 1 | 1 | 0 | 14 | 0 | 0 | 0 | 0 | 0 | 0 | 0 | 0 | 0 | 1 | 1 | 1 | 1 | 1 | 2 | 0 | 15 | 0 | 0 | 0 | 0 | 0 | 0 | 0 | 0 | 0 | 0 | 1 | 0 | 1 | 2 | 3 | 4 |
| Tabulation of Expected Results | ||||||||||||||||
| Perceived_Usefulness x Perceived_Ease_of_Use | ||||||||||||||||
| 5 | 6 | 7 | 8 | 9 | 10 | 11 | 12 | 13 | 14 | 15 | 16 | 17 | 18 | 19 | 20 | 3 | 0.01 | 0.01 | 0.01 | 0.01 | 0.03 | 0.05 | 0.09 | 0.09 | 0.09 | 0.18 | 0.17 | 0.12 | 0.04 | 0.03 | 0.04 | 0.02 | 6 | 0.06 | 0.12 | 0.12 | 0.06 | 0.37 | 0.55 | 0.98 | 1.04 | 1.04 | 1.97 | 1.91 | 1.29 | 0.43 | 0.31 | 0.49 | 0.25 | 7 | 0.03 | 0.06 | 0.06 | 0.03 | 0.17 | 0.25 | 0.45 | 0.47 | 0.47 | 0.89 | 0.87 | 0.59 | 0.2 | 0.14 | 0.22 | 0.11 | 8 | 0.05 | 0.1 | 0.1 | 0.05 | 0.3 | 0.45 | 0.8 | 0.85 | 0.85 | 1.61 | 1.56 | 1.06 | 0.35 | 0.25 | 0.4 | 0.2 | 9 | 0.2 | 0.4 | 0.4 | 0.2 | 1.21 | 1.81 | 3.22 | 3.42 | 3.42 | 6.44 | 6.23 | 4.22 | 1.41 | 1.01 | 1.61 | 0.8 | 10 | 0.13 | 0.27 | 0.27 | 0.13 | 0.8 | 1.21 | 2.15 | 2.28 | 2.28 | 4.29 | 4.16 | 2.82 | 0.94 | 0.67 | 1.07 | 0.54 | 11 | 0.16 | 0.32 | 0.32 | 0.16 | 0.97 | 1.46 | 2.59 | 2.75 | 2.75 | 5.18 | 5.02 | 3.4 | 1.13 | 0.81 | 1.3 | 0.65 | 12 | 0.22 | 0.44 | 0.44 | 0.22 | 1.31 | 1.96 | 3.49 | 3.7 | 3.7 | 6.97 | 6.75 | 4.58 | 1.53 | 1.09 | 1.74 | 0.87 | 13 | 0.04 | 0.08 | 0.08 | 0.04 | 0.23 | 0.35 | 0.63 | 0.66 | 0.66 | 1.25 | 1.21 | 0.82 | 0.27 | 0.2 | 0.31 | 0.16 | 14 | 0.04 | 0.08 | 0.08 | 0.04 | 0.23 | 0.35 | 0.63 | 0.66 | 0.66 | 1.25 | 1.21 | 0.82 | 0.27 | 0.2 | 0.31 | 0.16 | 15 | 0.06 | 0.12 | 0.12 | 0.06 | 0.37 | 0.55 | 0.98 | 1.04 | 1.04 | 1.97 | 1.91 | 1.29 | 0.43 | 0.31 | 0.49 | 0.25 |
| Statistical Results | |
| Pearson's Chi-squared test | |
| Pearson Chi Square Statistic | 394.05 |
| Degrees of Freedom | 150 |
| P value | 0 |