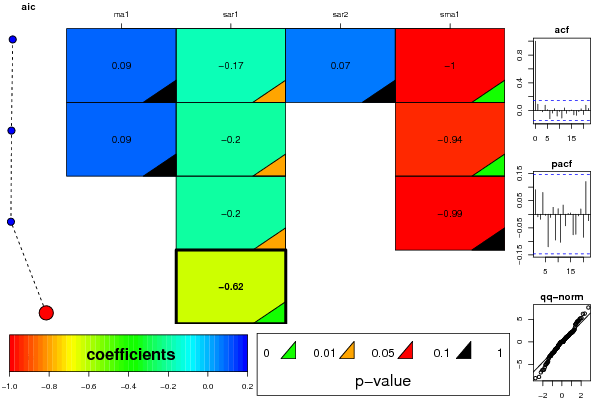
| ARIMA Parameter Estimation and Backward Selection | ||||
| Iteration | ma1 | sar1 | sar2 | sma1 |
| Estimates ( 1 ) | 0.0866 | -0.1735 | 0.0689 | -1 |
| (p-val) | (0.2616 ) | (0.0438 ) | (0.4302 ) | (0 ) |
| Estimates ( 2 ) | 0.0914 | -0.1989 | 0 | -0.9412 |
| (p-val) | (0.237 ) | (0.0348 ) | (NA ) | (0 ) |
| Estimates ( 3 ) | 0 | -0.2033 | 0 | -0.9913 |
| (p-val) | (NA ) | (0.0193 ) | (NA ) | (0.2538 ) |
| Estimates ( 4 ) | 0 | -0.6211 | 0 | 0 |
| (p-val) | (NA ) | (0 ) | (NA ) | (NA ) |
| Estimates ( 5 ) | NA | NA | NA | NA |
| (p-val) | (NA ) | (NA ) | (NA ) | (NA ) |
| Estimates ( 6 ) | NA | NA | NA | NA |
| (p-val) | (NA ) | (NA ) | (NA ) | (NA ) |
| Estimates ( 7 ) | NA | NA | NA | NA |
| (p-val) | (NA ) | (NA ) | (NA ) | (NA ) |
| Menu of Residual Diagnostics | |
| Description | Link |
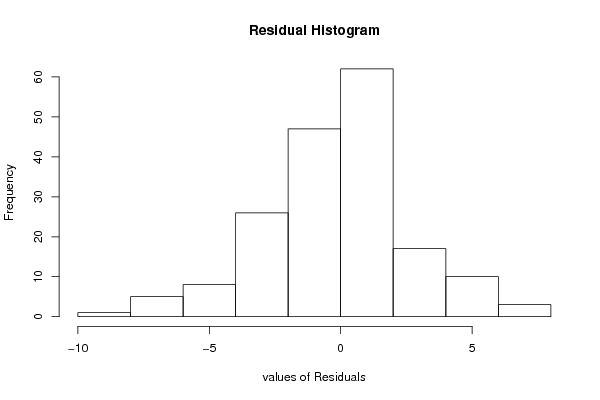
| Histogram | Compute |
| Central Tendency | Compute |
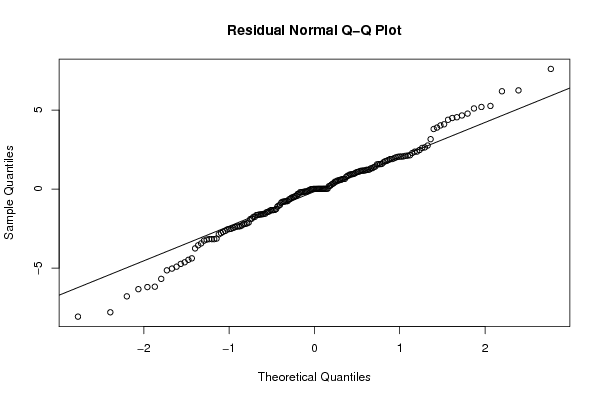
| QQ Plot | Compute |
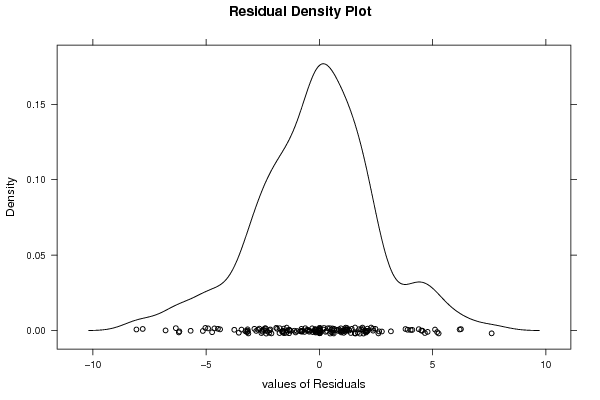
| Kernel Density Plot | Compute |
| Skewness/Kurtosis Test | Compute |
| Skewness-Kurtosis Plot | Compute |
| Harrell-Davis Plot | Compute |
| Bootstrap Plot -- Central Tendency | Compute |
| Blocked Bootstrap Plot -- Central Tendency | Compute |
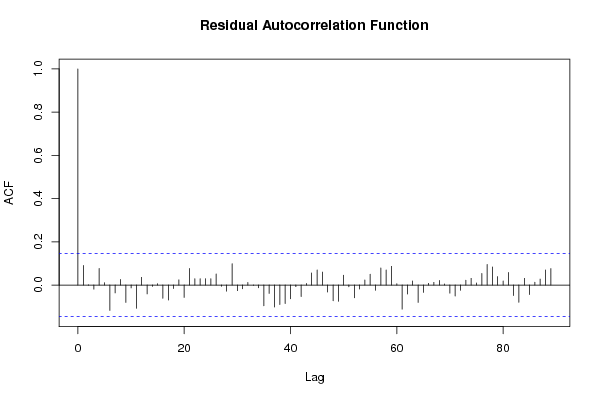
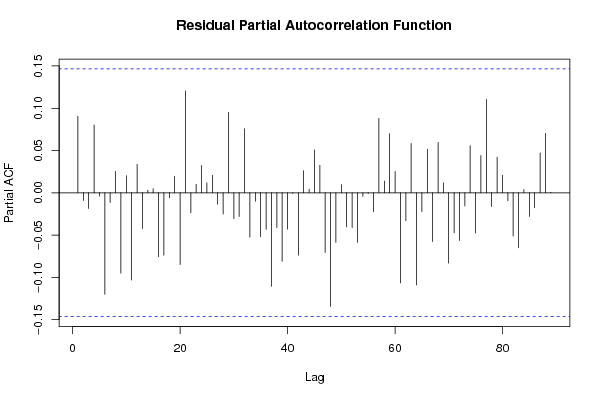
| (Partial) Autocorrelation Plot | Compute |
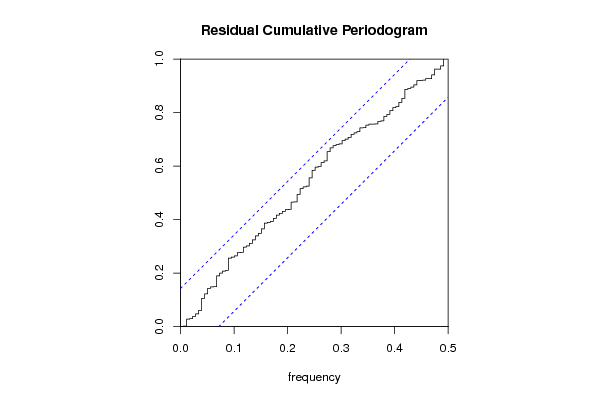
| Spectral Analysis | Compute |
| Tukey lambda PPCC Plot | Compute |
| Box-Cox Normality Plot | Compute |
| Summary Statistics | Compute |