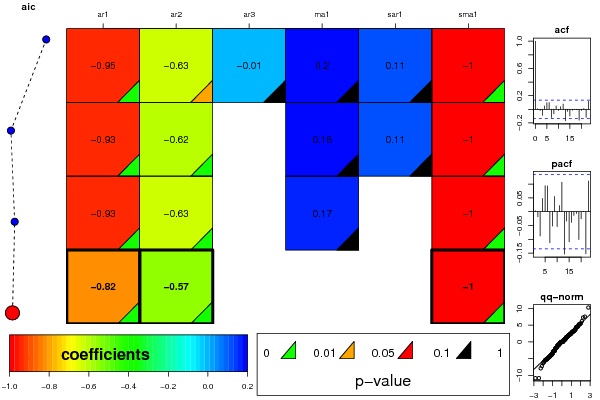
| ARIMA Parameter Estimation and Backward Selection | ||||||
| Iteration | ar1 | ar2 | ar3 | ma1 | sar1 | sma1 |
| Estimates ( 1 ) | -0.9474 | -0.6273 | -0.0086 | 0.1962 | 0.1136 | -1 |
| (p-val) | (0.0067 ) | (0.0307 ) | (0.9664 ) | (0.5627 ) | (0.1411 ) | (0 ) |
| Estimates ( 2 ) | -0.9334 | -0.6155 | 0 | 0.1828 | 0.1136 | -1 |
| (p-val) | (0 ) | (0 ) | (NA ) | (0.1247 ) | (0.141 ) | (0 ) |
| Estimates ( 3 ) | -0.9343 | -0.6261 | 0 | 0.1688 | 0 | -1 |
| (p-val) | (0 ) | (0 ) | (NA ) | (0.142 ) | (NA ) | (0 ) |
| Estimates ( 4 ) | -0.8226 | -0.5672 | 0 | 0 | 0 | -1 |
| (p-val) | (0 ) | (0 ) | (NA ) | (NA ) | (NA ) | (0 ) |
| Estimates ( 5 ) | NA | NA | NA | NA | NA | NA |
| (p-val) | (NA ) | (NA ) | (NA ) | (NA ) | (NA ) | (NA ) |
| Estimates ( 6 ) | NA | NA | NA | NA | NA | NA |
| (p-val) | (NA ) | (NA ) | (NA ) | (NA ) | (NA ) | (NA ) |
| Estimates ( 7 ) | NA | NA | NA | NA | NA | NA |
| (p-val) | (NA ) | (NA ) | (NA ) | (NA ) | (NA ) | (NA ) |
| Estimates ( 8 ) | NA | NA | NA | NA | NA | NA |
| (p-val) | (NA ) | (NA ) | (NA ) | (NA ) | (NA ) | (NA ) |
| Estimates ( 9 ) | NA | NA | NA | NA | NA | NA |
| (p-val) | (NA ) | (NA ) | (NA ) | (NA ) | (NA ) | (NA ) |
| Estimates ( 10 ) | NA | NA | NA | NA | NA | NA |
| (p-val) | (NA ) | (NA ) | (NA ) | (NA ) | (NA ) | (NA ) |
| Estimates ( 11 ) | NA | NA | NA | NA | NA | NA |
| (p-val) | (NA ) | (NA ) | (NA ) | (NA ) | (NA ) | (NA ) |
| Menu of Residual Diagnostics | |
| Description | Link |
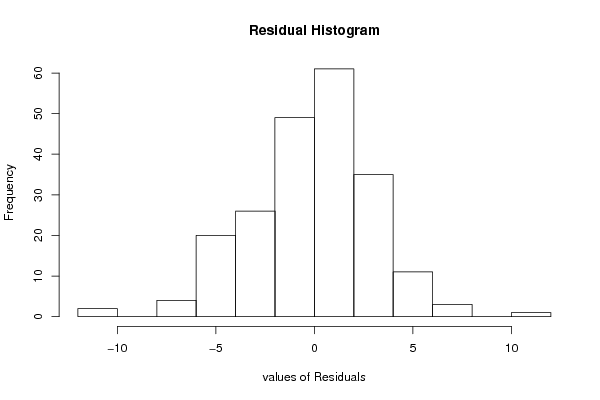
| Histogram | Compute |
| Central Tendency | Compute |
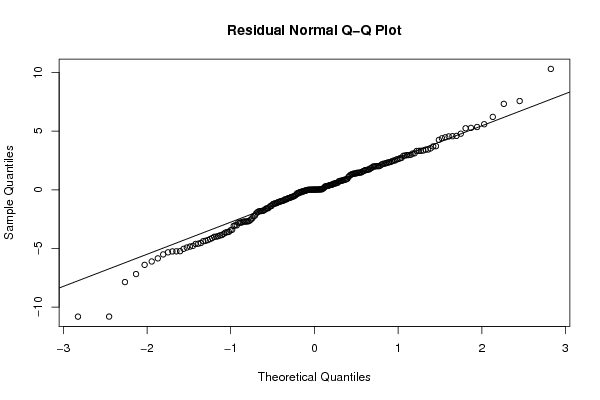
| QQ Plot | Compute |
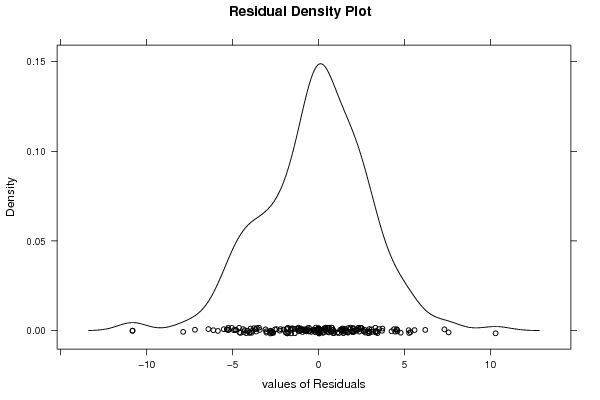
| Kernel Density Plot | Compute |
| Skewness/Kurtosis Test | Compute |
| Skewness-Kurtosis Plot | Compute |
| Harrell-Davis Plot | Compute |
| Bootstrap Plot -- Central Tendency | Compute |
| Blocked Bootstrap Plot -- Central Tendency | Compute |
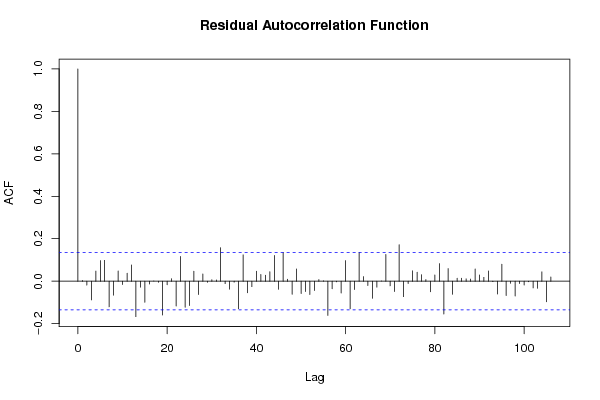
| (Partial) Autocorrelation Plot | Compute |
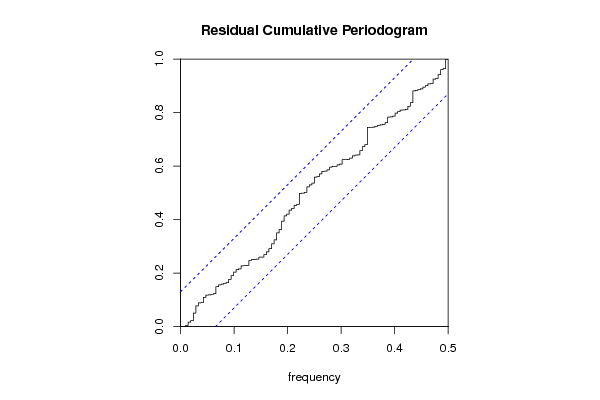
| Spectral Analysis | Compute |
| Tukey lambda PPCC Plot | Compute |
| Box-Cox Normality Plot | Compute |
| Summary Statistics | Compute |